Get started
Step 1: Add required environments
Applications always have requirements that analyze pages with different environments, like devices, networks, headers and so on.
So before we start to analyze pages, we need to set up these operating environments.
Set Profile
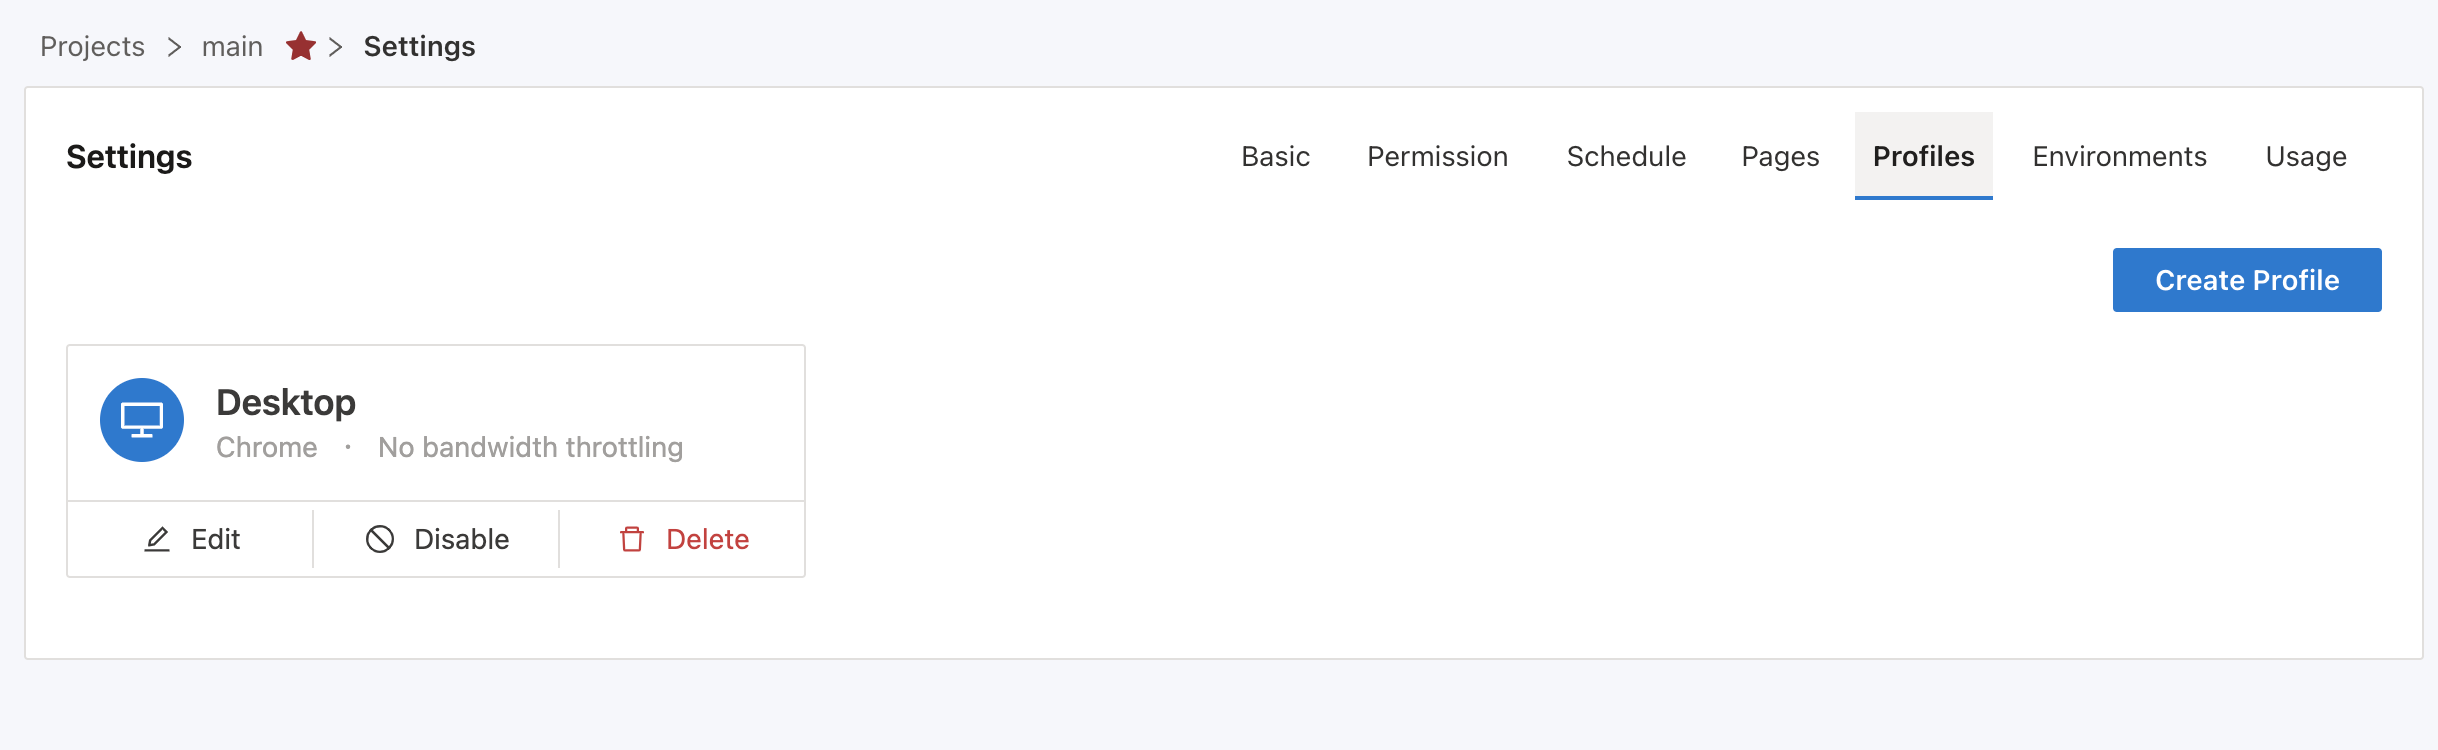
Profile is the place that used to manage the devices the analysis progress will use, including window size, CPU speed, network status and other information.
After entering a project, you can add or modify a profile on the settings page. Refer to Profile configuration for more details.
We pre-created a Desktop profile for all projects by default. This Profile will set the running window to 1920x1080, without network throttling and CPU throttling.
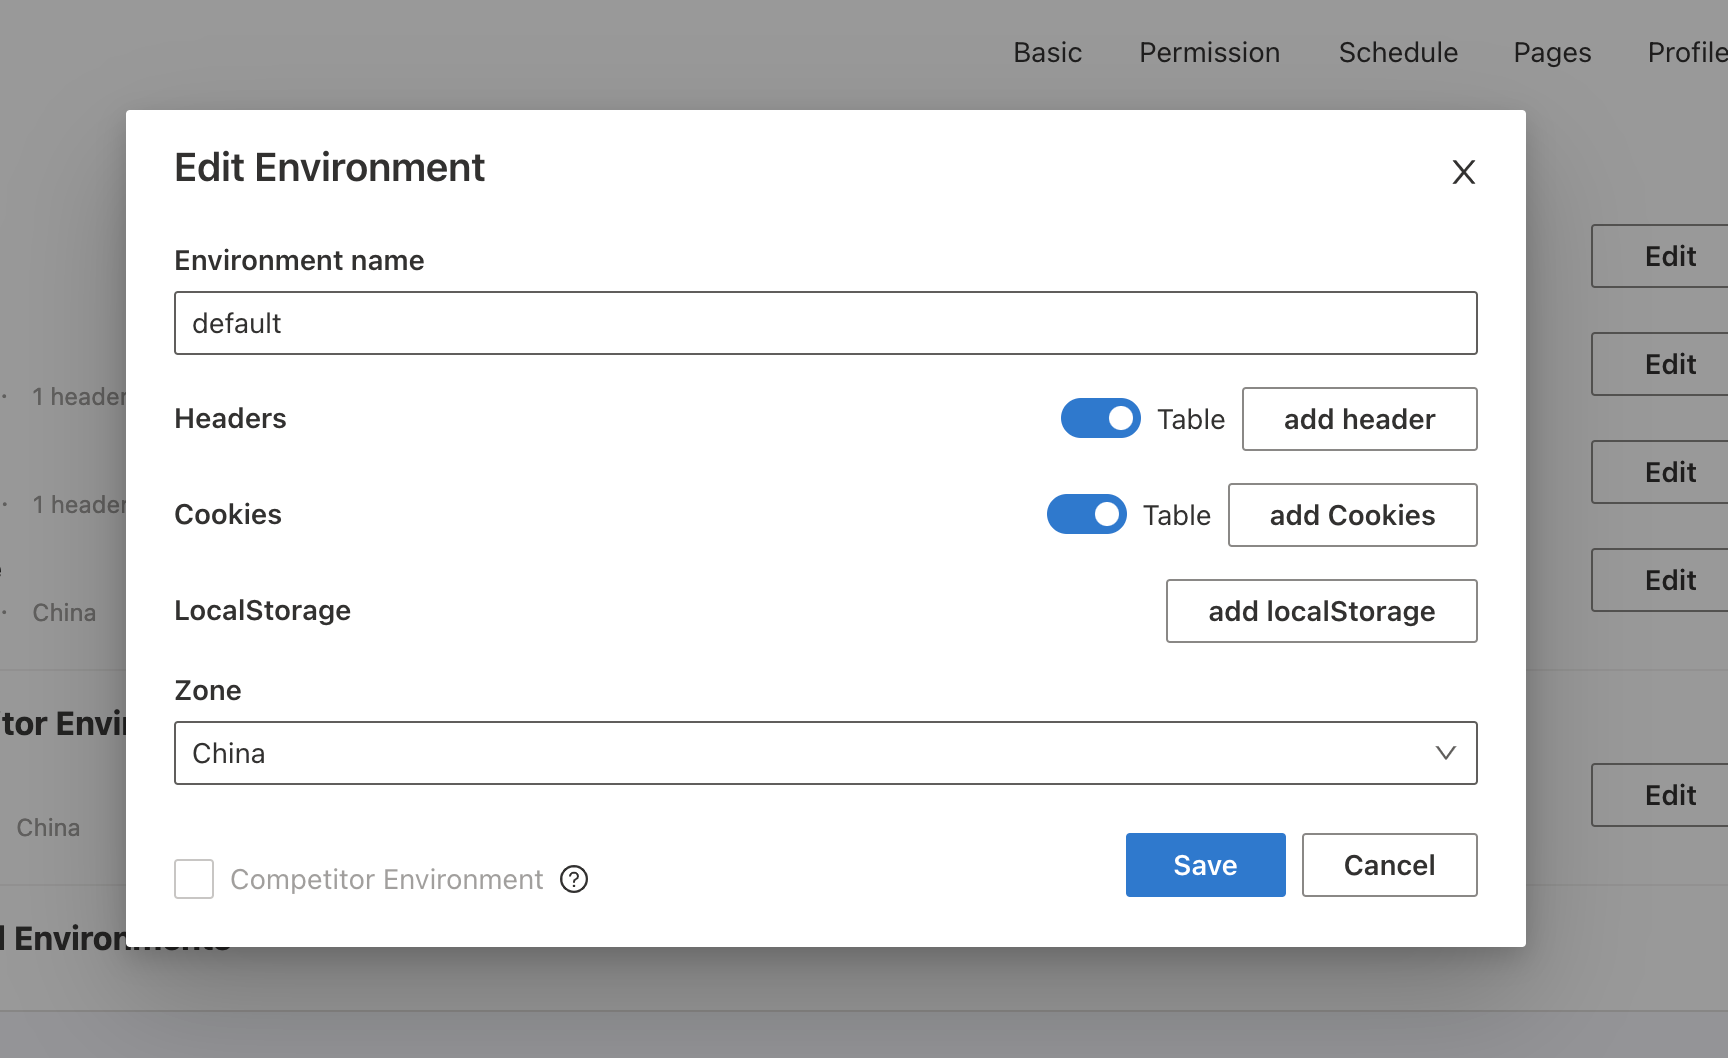
Set environment
In many cases, we cannot directly access the site to be tested, such as applications that need to be logged in. In these cases, we need to create a corresponding Environment to add the necessary settings for accessing, setting custom headers or cookies in the Environment.
Refer to Environment configuration for more details.
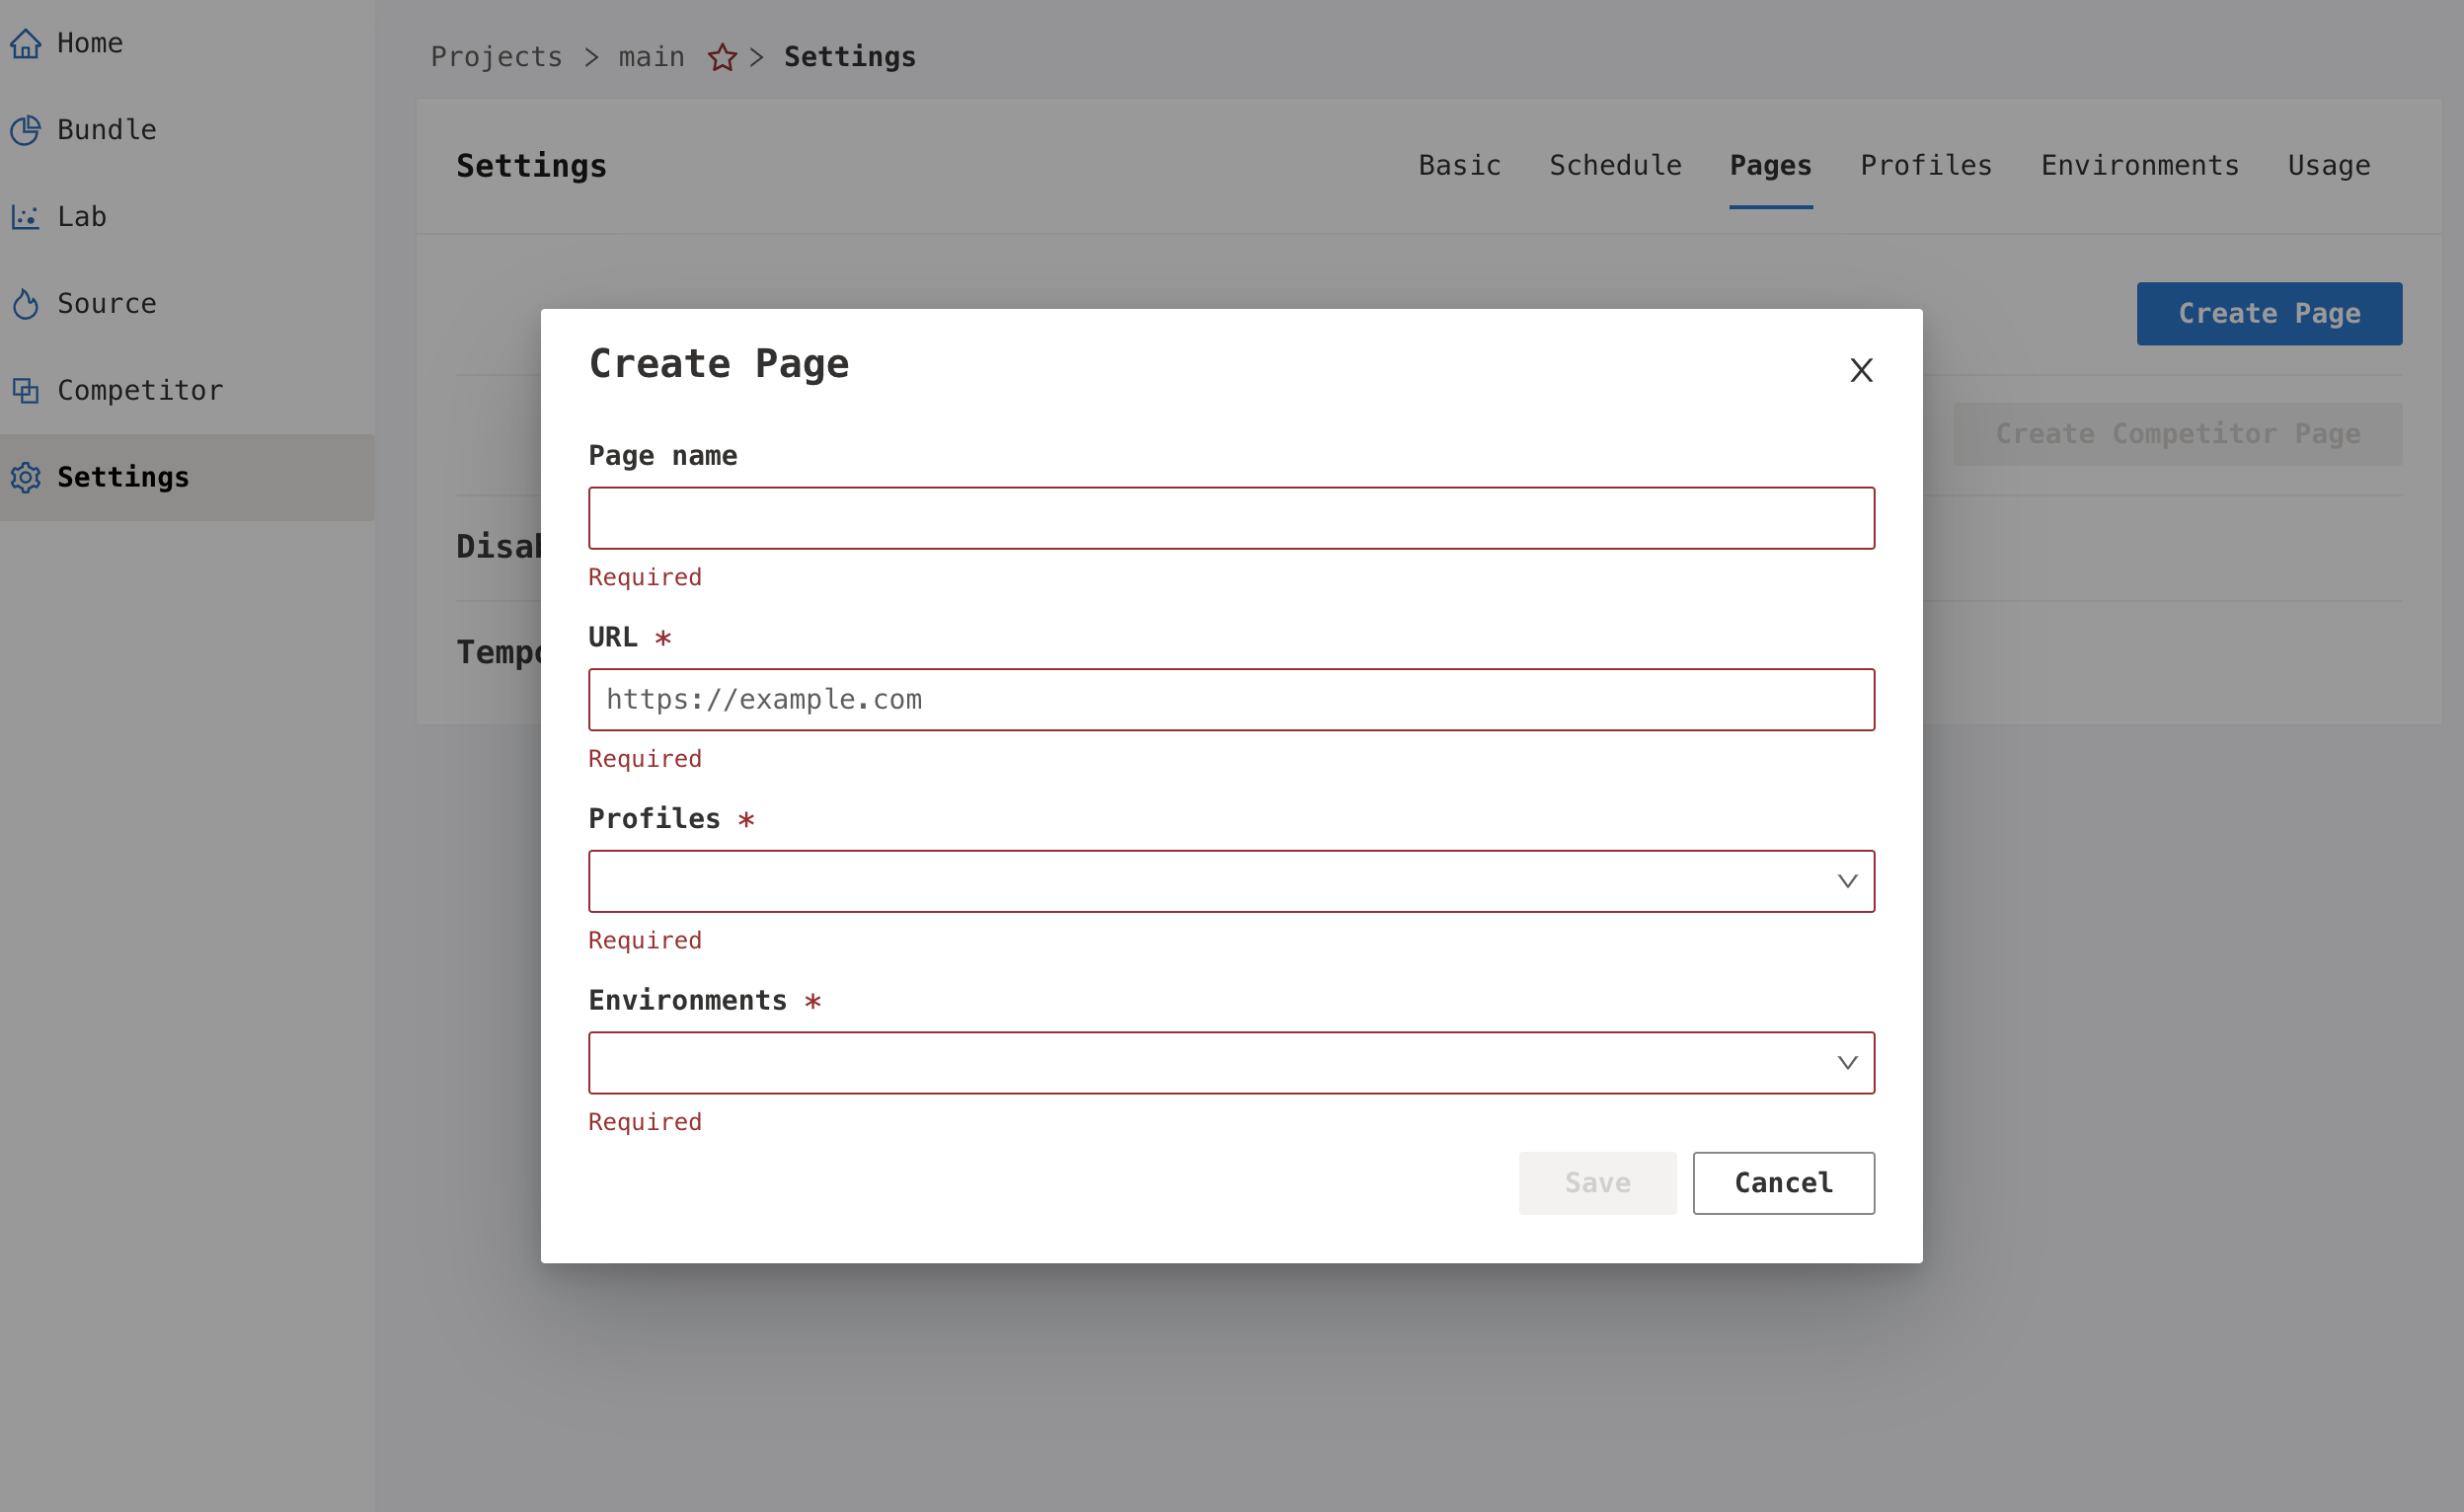
Step 2: Add a page
After configuring profiles and environments, it’s time to add the pages that need to be analyzed.
Adding a page requires filling up the URL, an easy-to-identify alias (name), and associating the Profile and Environment settings that were created before.
Refer to Page configuration for more details.
Step 3: Take a snapshot manually
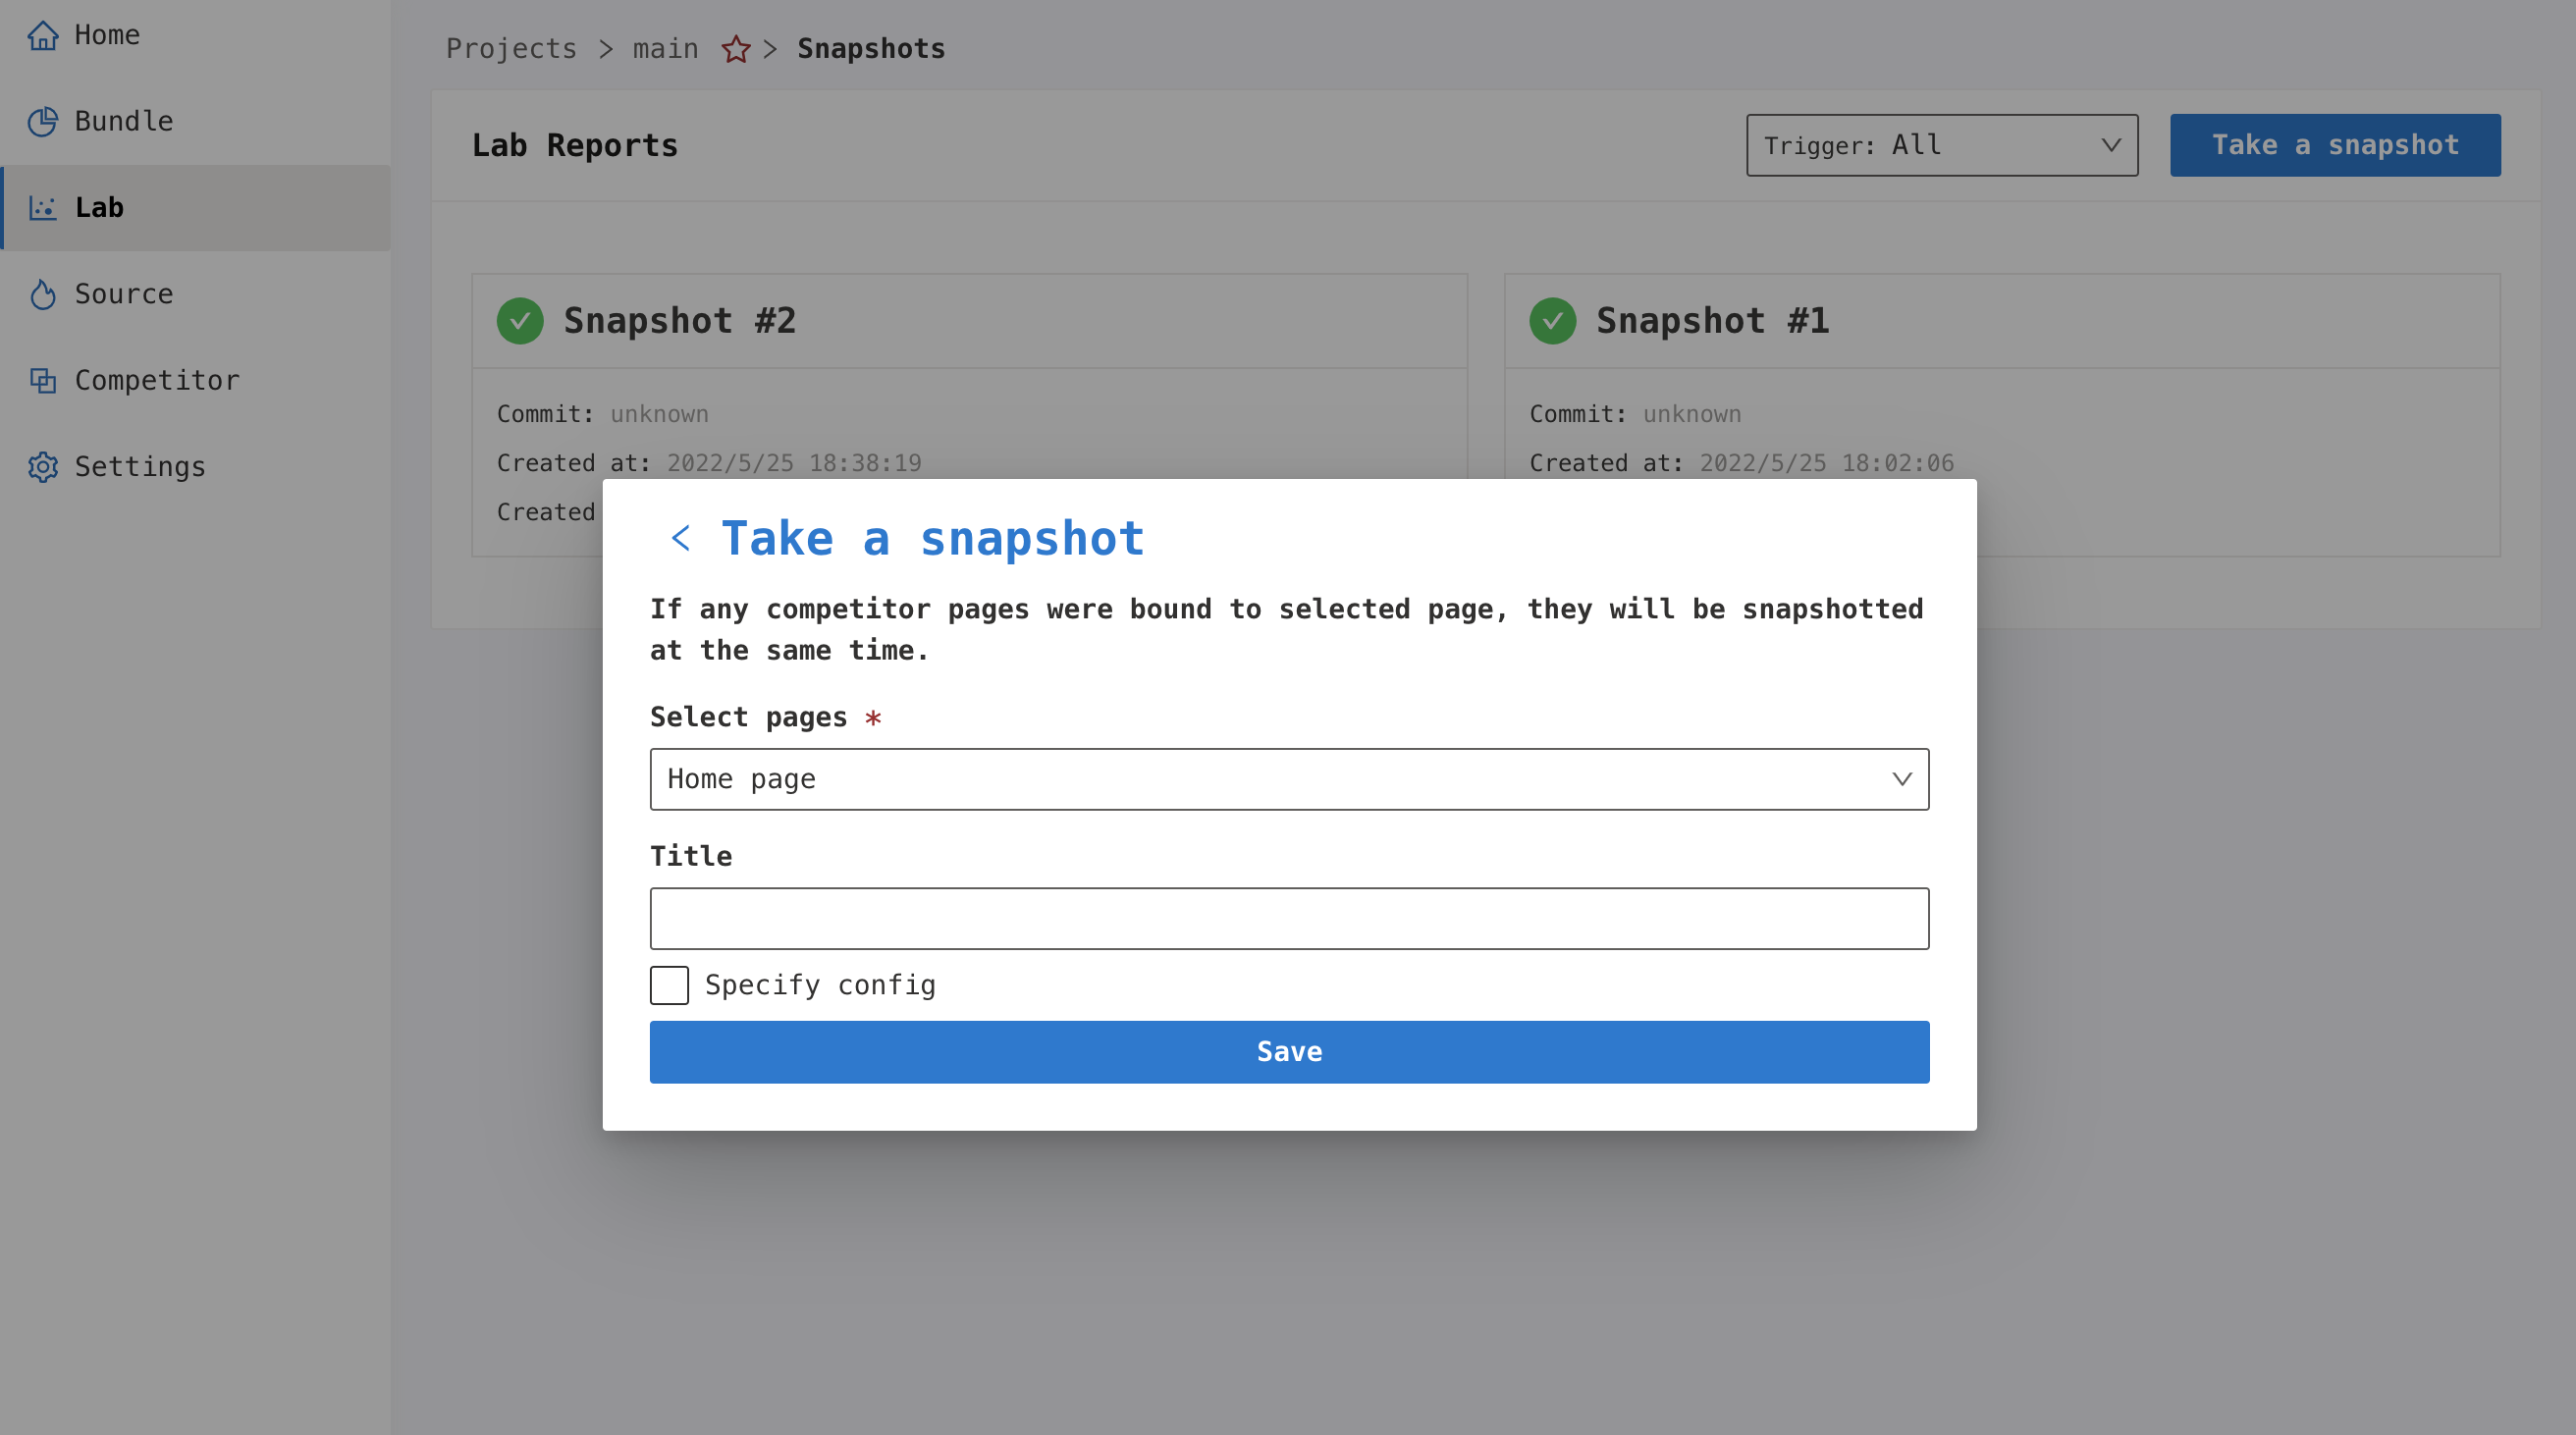
Navigate to the Lab module at the left navigation bar. After entering the Lab module, a list of historical scan records (Snapshots) will be displayed. Click the Take a snapshot button at the top right of the list to manually trigger a scan.
After clicking, a setting box will pop up, select the Pages you want to analyze along with specifiable Profiles and Environments. At the same time, you can also specify an easily distinguishable Title to name the Snapshot.
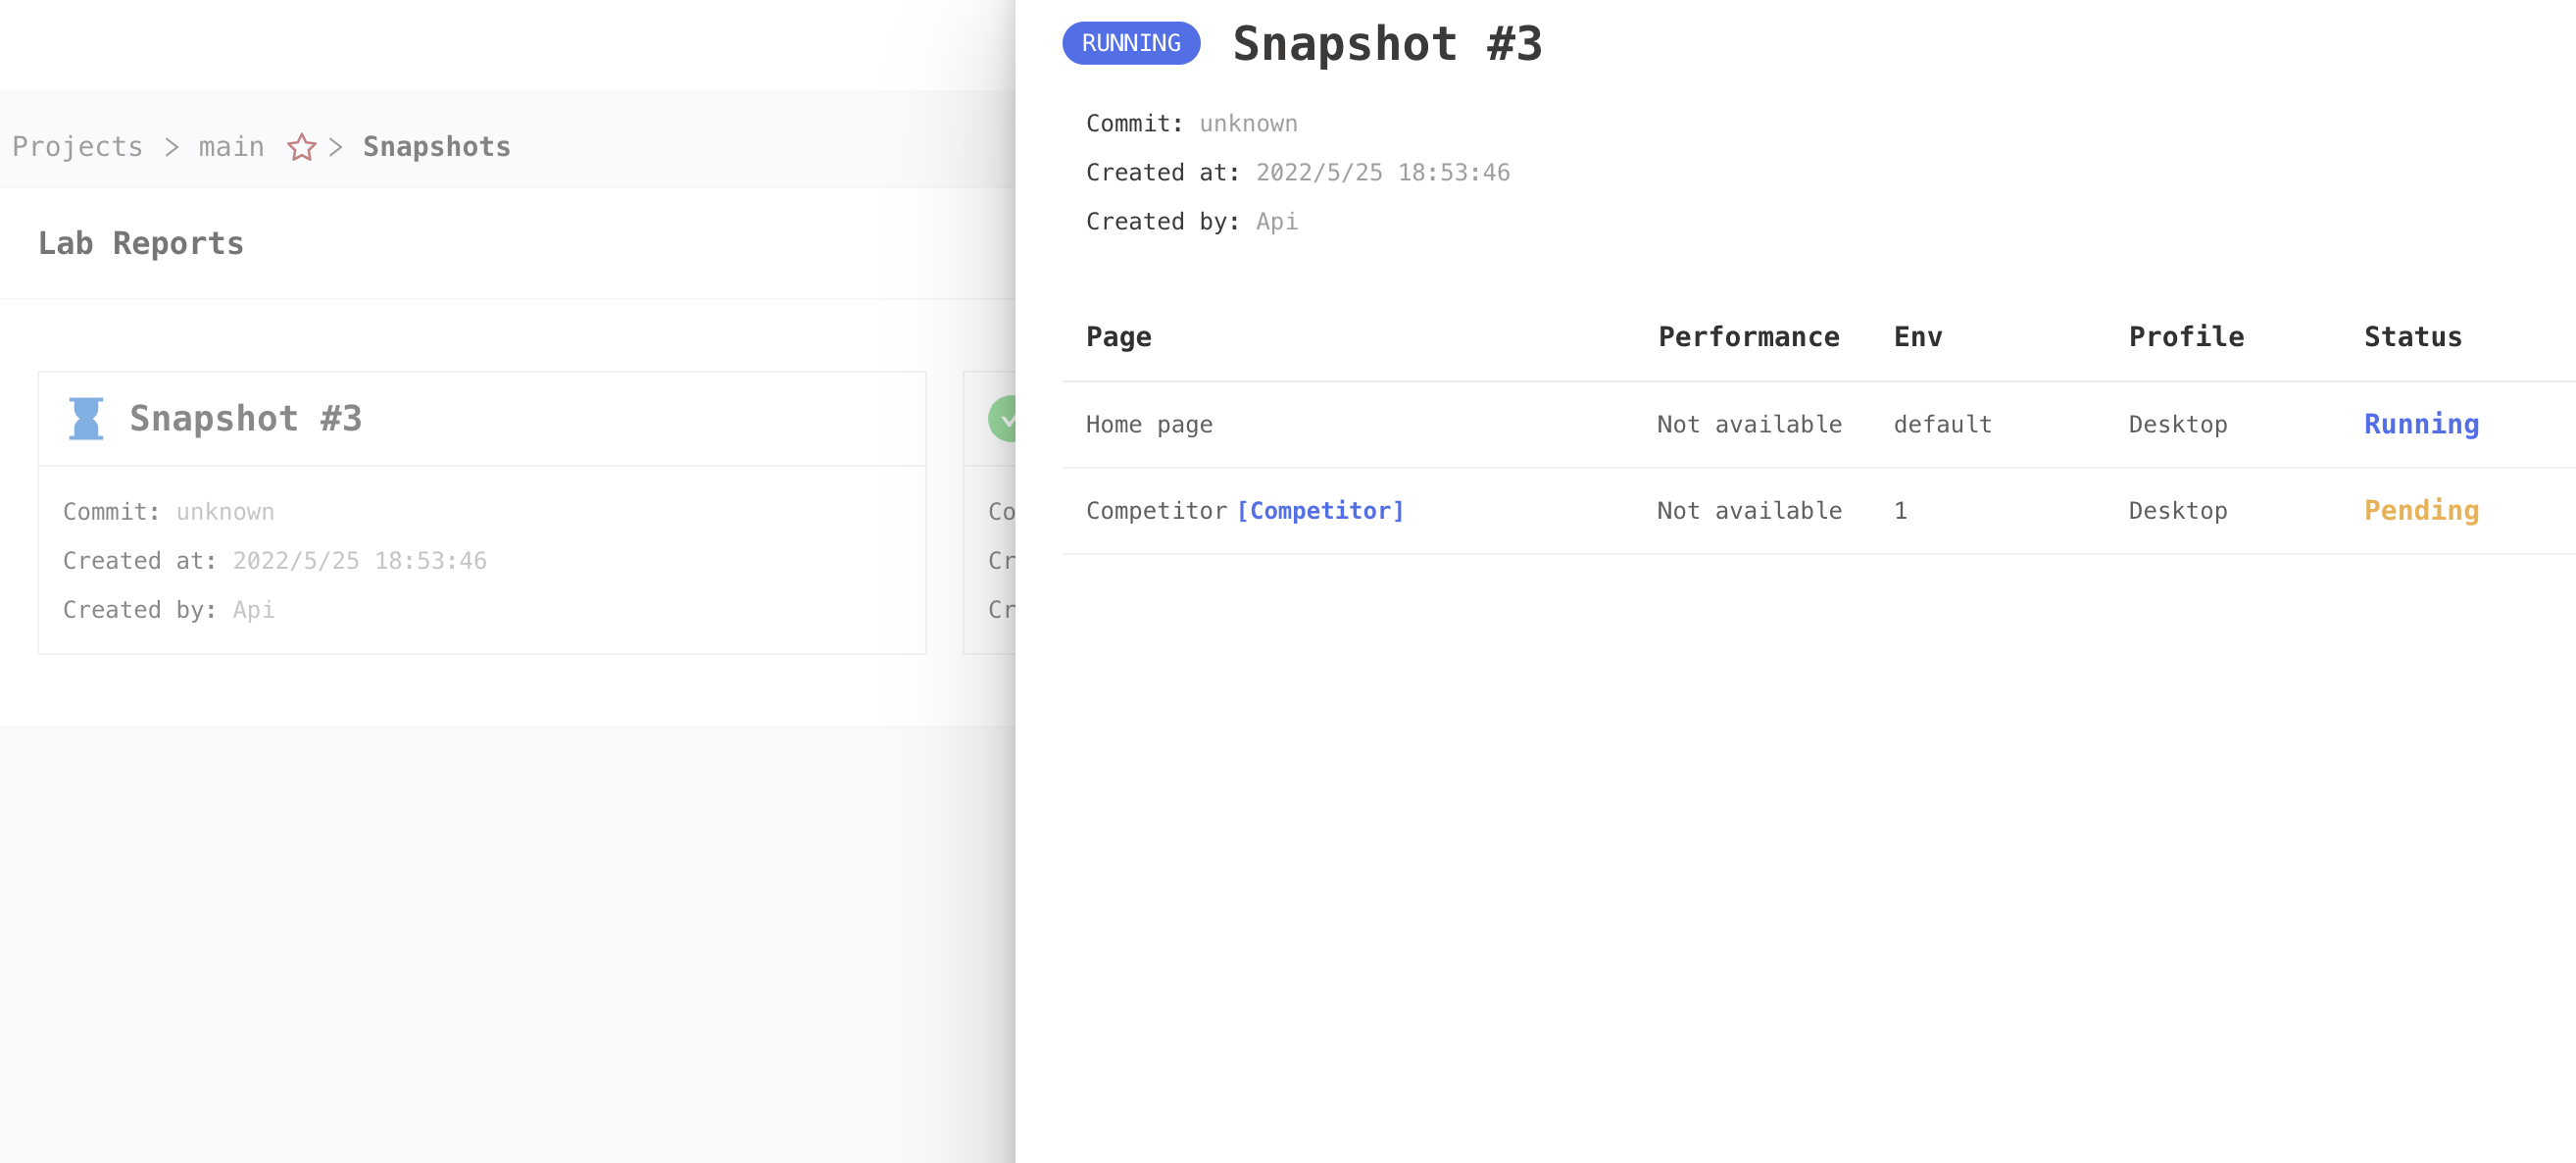
We define one run of Lab analysis as a Snapshot. A snapshot contains running reports of multiple pages and multiple environments.
For example, if we choose to analyze 3 pages, each page is associated with 2 Profiles and 2 Environments, then there will be 12 (3 x 2 x 2) reports generated in one snapshot.
In order to provide the most reliable result, each page x profile x env combination will be analyzed 5 times, and the report with the most stable key metrics will be selected as the final result.
Step 4: View the results
Clicking on the Snapshot card in the Lab module will pop up all the running results contained in the Snapshot, and enter the report you want to view according to the site name and running environment.
Overview
More details explained in Snapshot Report
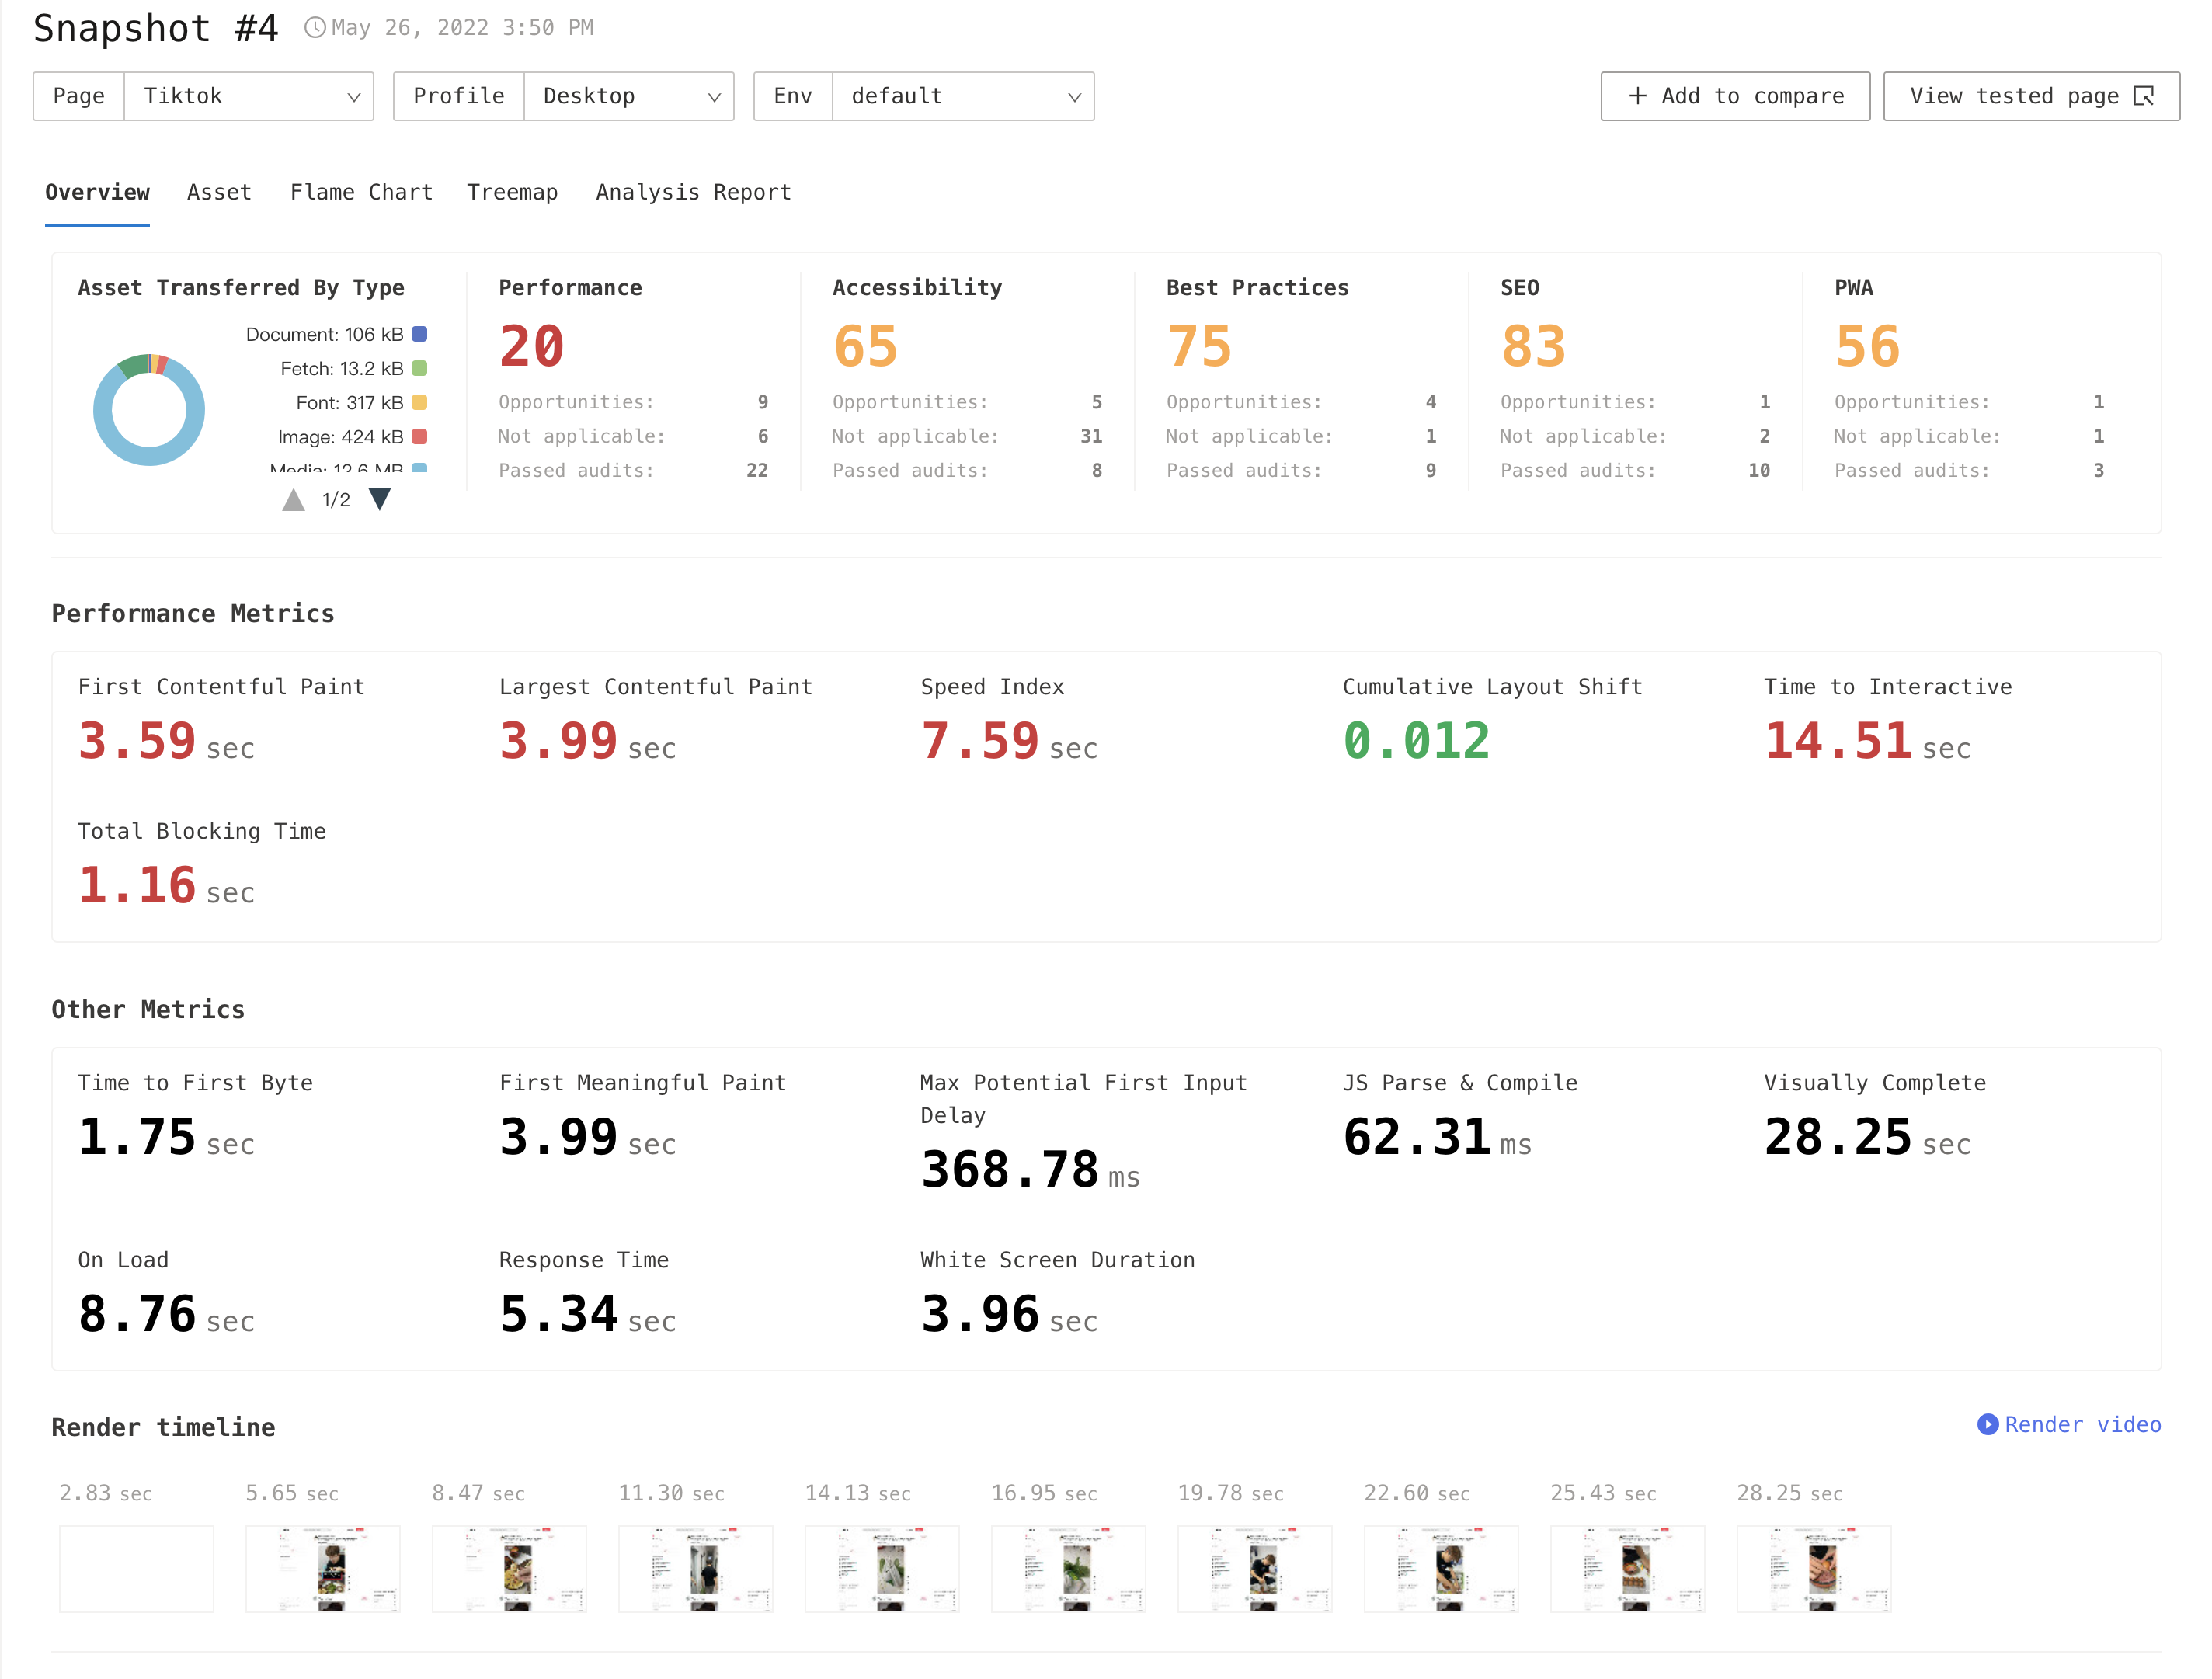
After entering the report page, the performance overview data will be displayed by default. The data includes:
- The pie chart of requested assets
- Key performance metrics (color-coded based on good, need improvement or poor)
- Run timeline screenshot
- Run screen recording
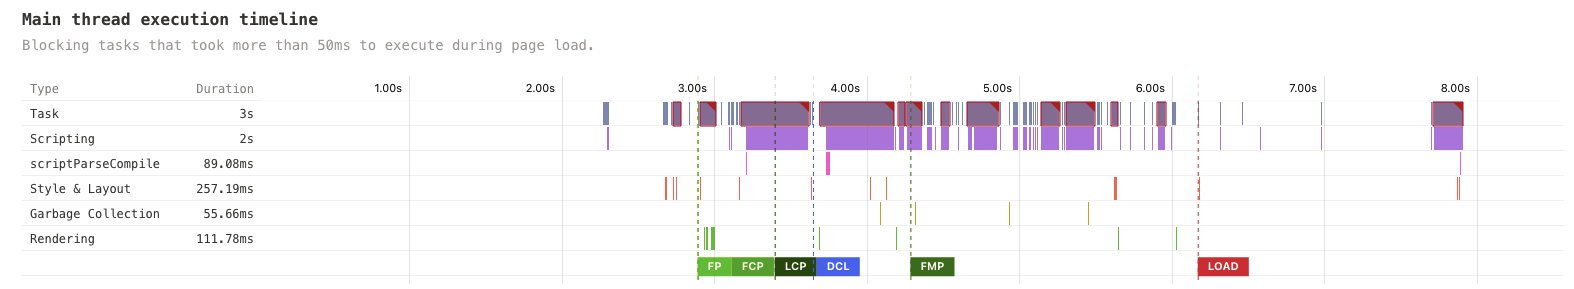
- Main thread execution timeline
Key performance metrics The key performance metrics will be marked with different colors in reports. The corresponding relationship between the score interval and the color is as follows:
- 0 ~ 49 (red): Slow
- 50 ~ 89 (orange): Average
- 90 ~ 100 (green): Fast
Main thread execution timeline It can directly tell us which part of the site is loading a long time-consuming rendering task or blocking JavaScript execution, combined with the request list can easily locate the performance bottleneck.
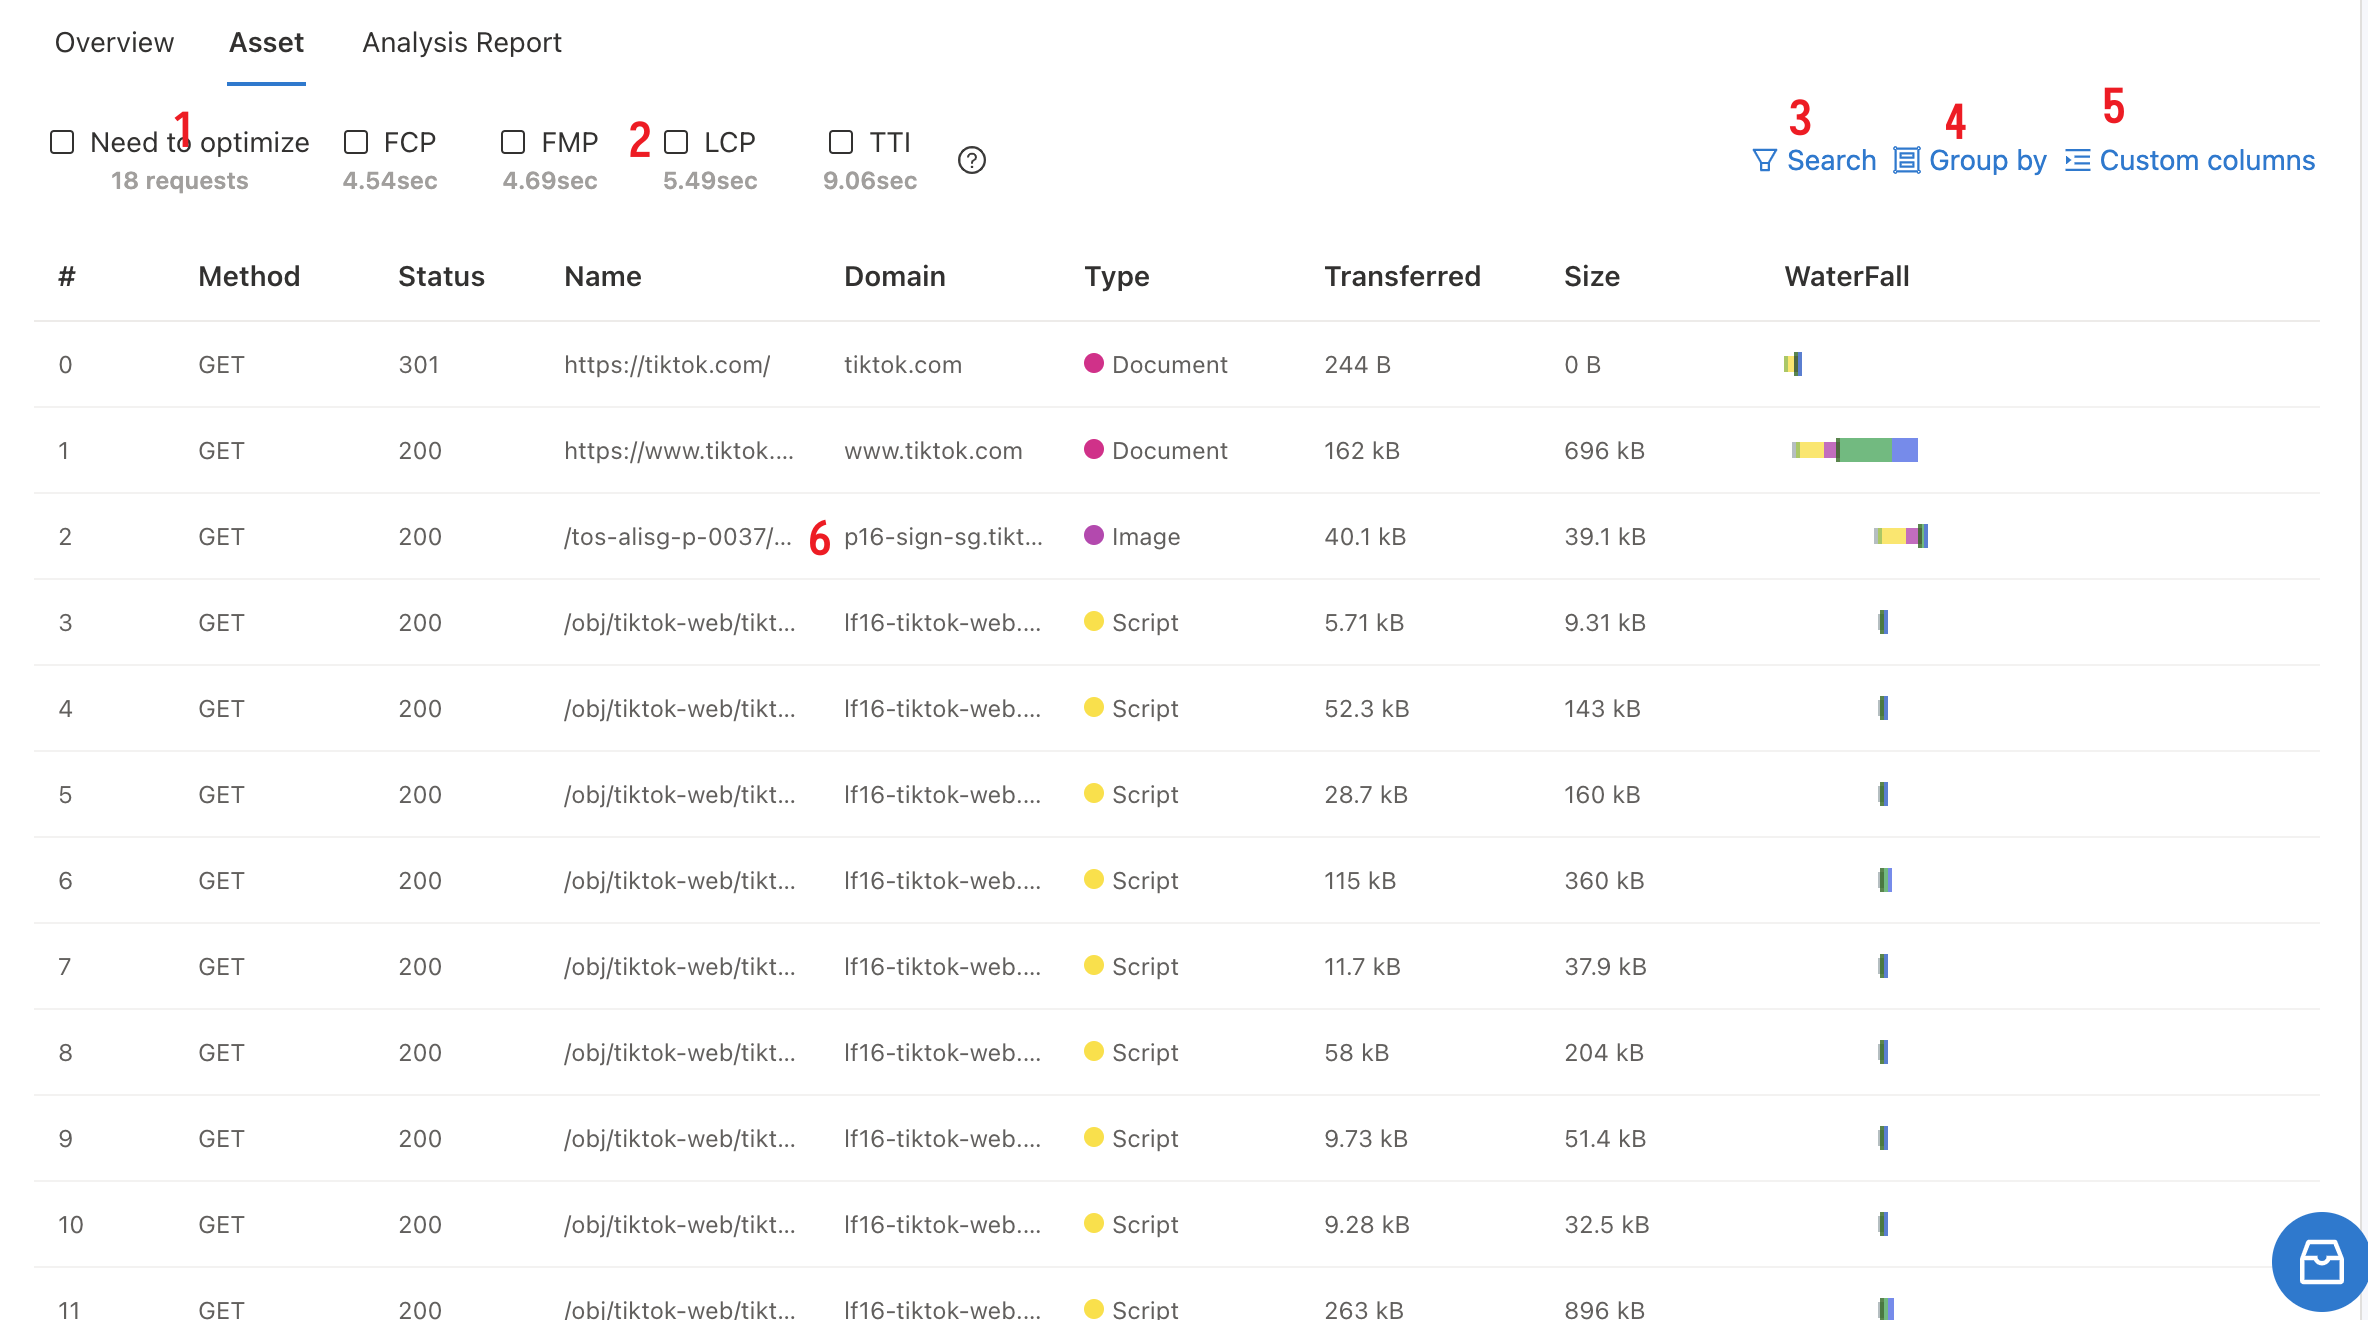
Requests list
The request list records all request information during the site loading process, and the list is arranged in ascending order according to the time when the request was issued. The table can be filtered, searched, and sorted. Clicking on the request will display the requested time information, request header, and response header information.
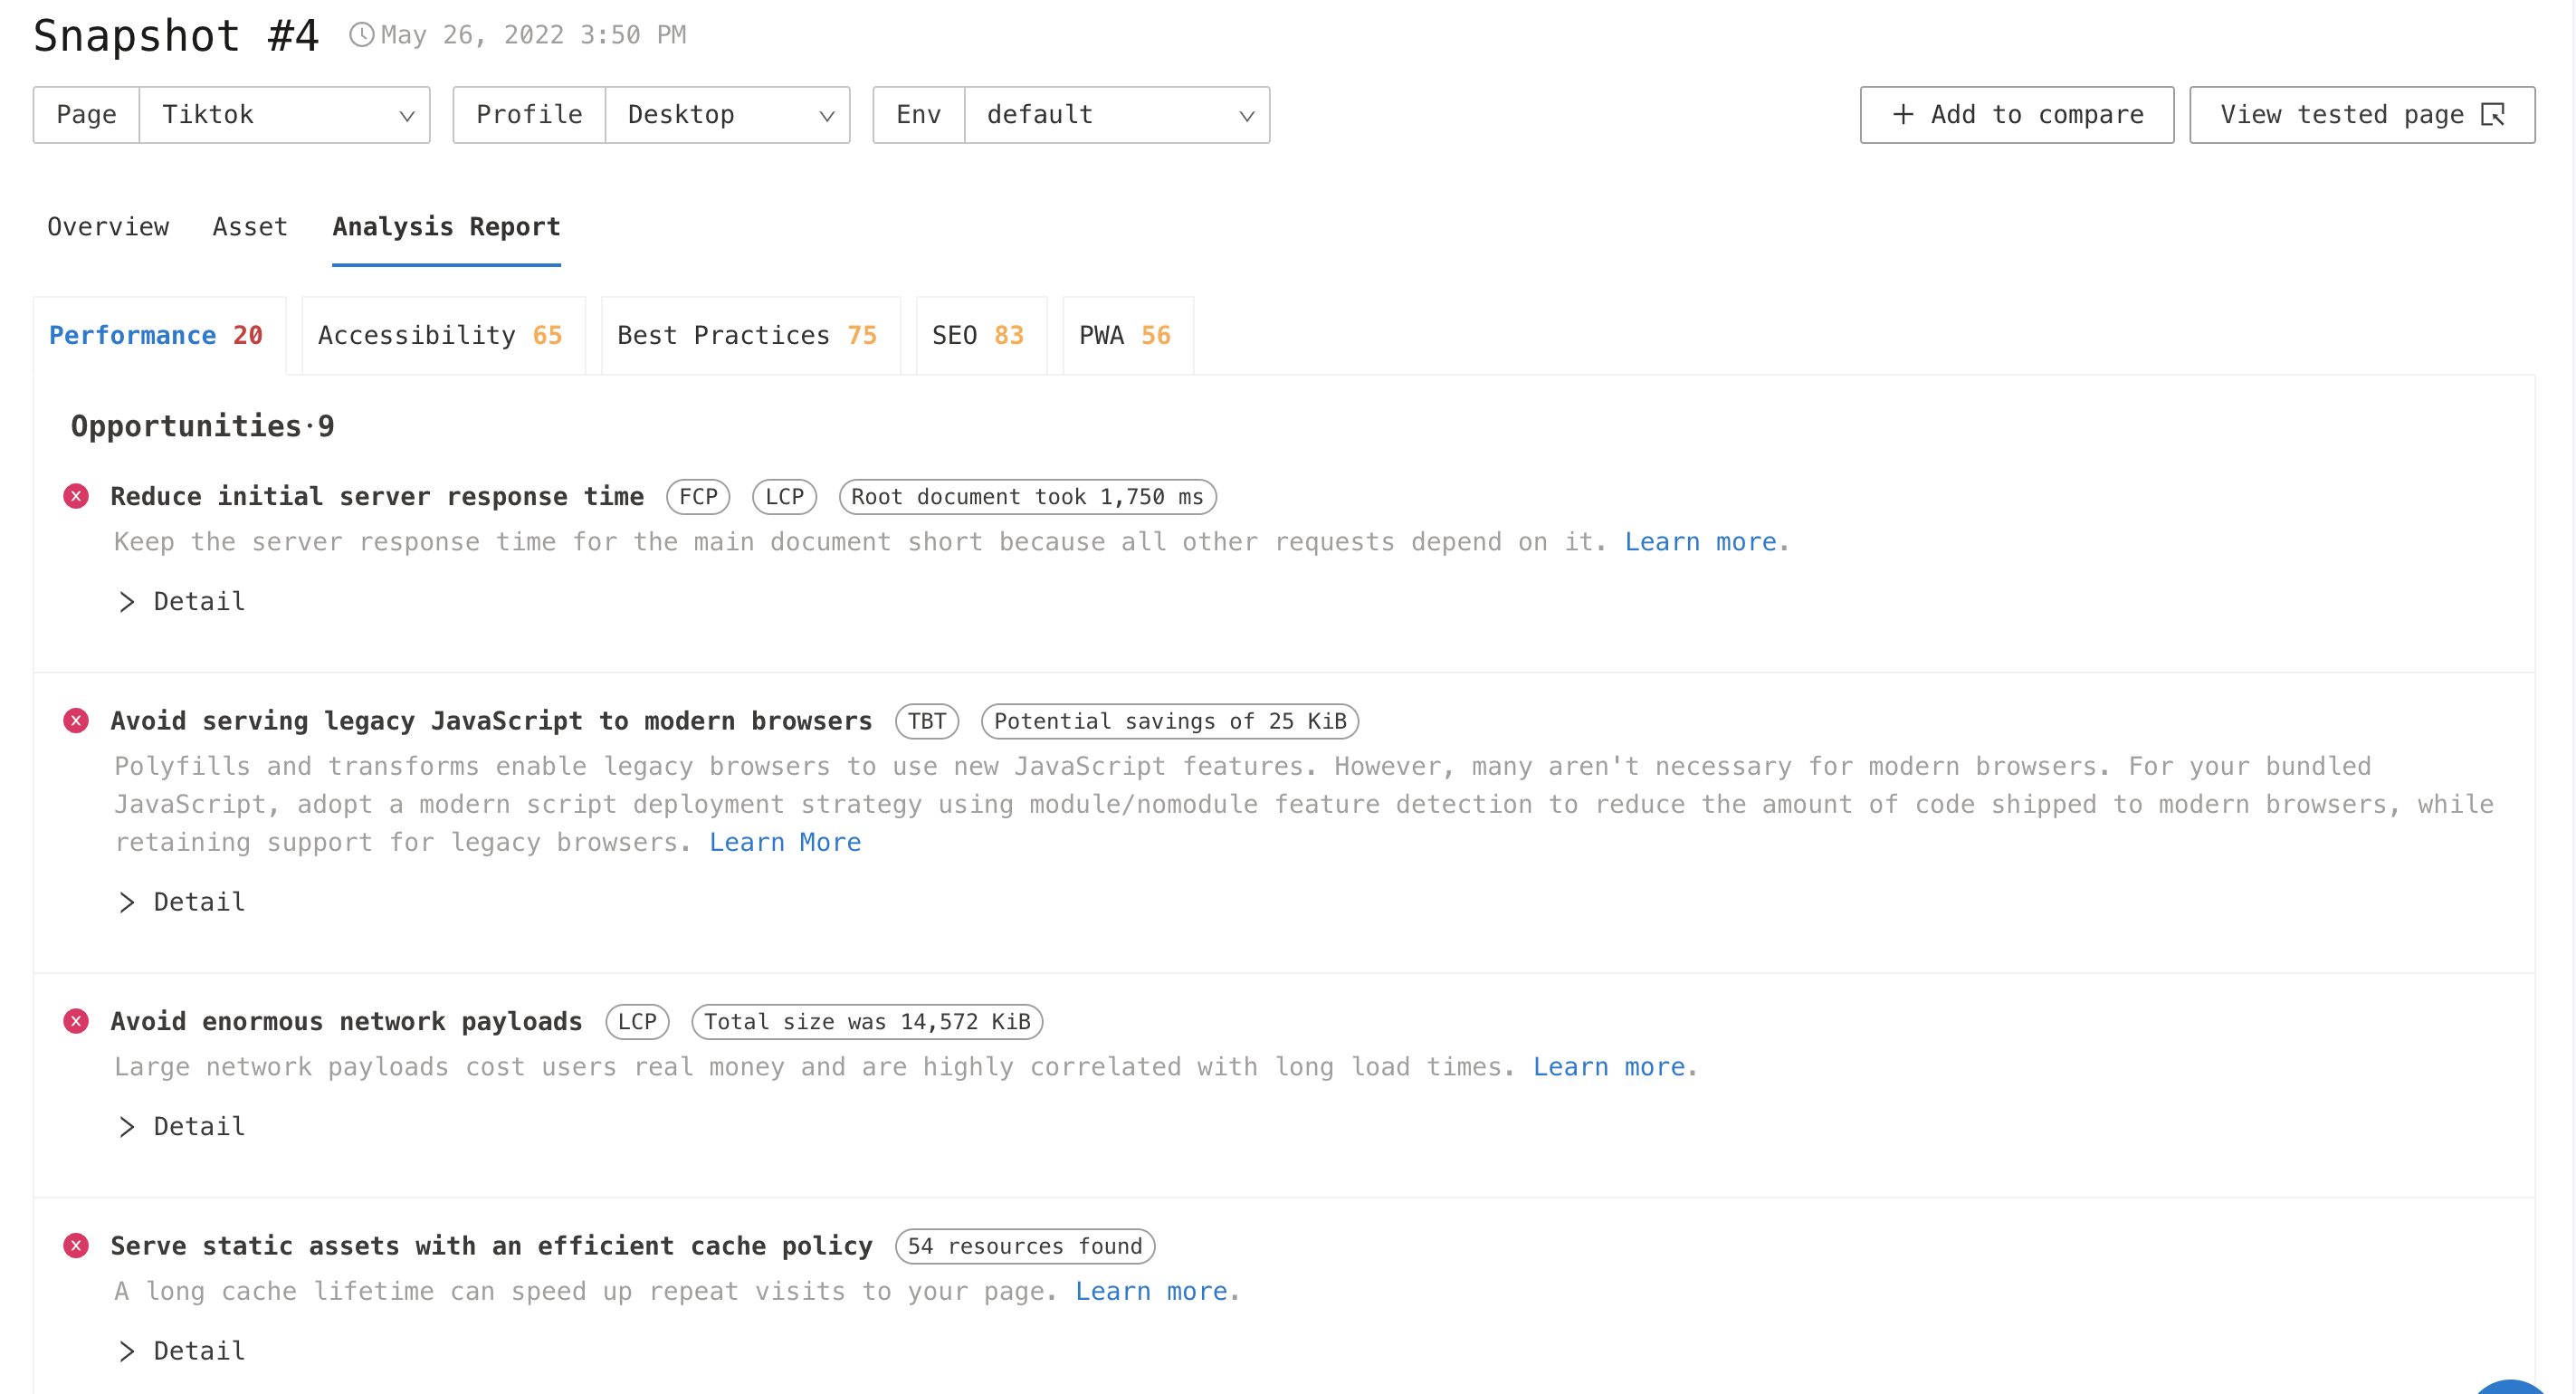
Lighthouse Score
Performance, SEO, Best Practices, Accessibility and PWA tabs provide information about passed and failed Lighthouse audits, highlighting opportunities for improvement.
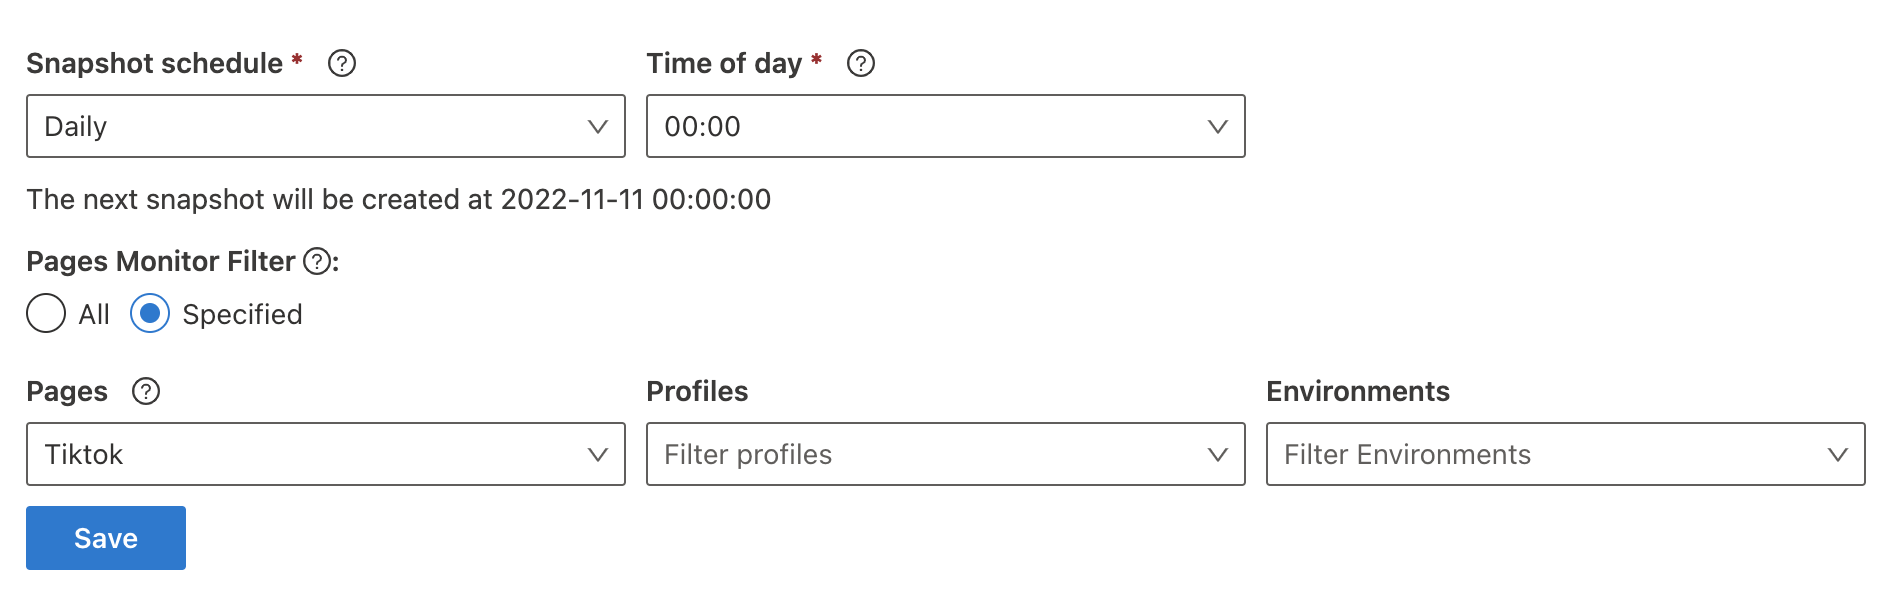
Step 5: Take a snapshot automatically
Select the Settings module in the left navigation bar and enter the Schedule page to create a scheduled task. Refer to Schedule configuration for more details.