How to use the E2E test
This feature is still in the experimental stage!
Background
The current Lab module is only geared towards first screen performance and cannot test user interoperability.
When doing performance analysis, some user interaction performance metrics can only be measured manually using chrome devtool, so a way to automatically measure page interaction performance and quantify it into performance metrics is needed.
Features
- Support for running user-supplied Puppeteer scripts to test page functionality and user interaction performance.
- Integrated Lighthouse User Flow feature to measure performance metrics and provide best practice recommendations.
- Focuses on performance analysis, providing performance analysis tools such as Flame Chart, Treemap, Lighthouse and more.
- Combined with the Source feature, it locates performance issues to the source code location.
Getting Started
Step 0: Add configuration
Follow the steps in Getting Started to edit Profiles and Environments.
Step 1: Add e2e page
Navigating to Project→Settings→E2E.
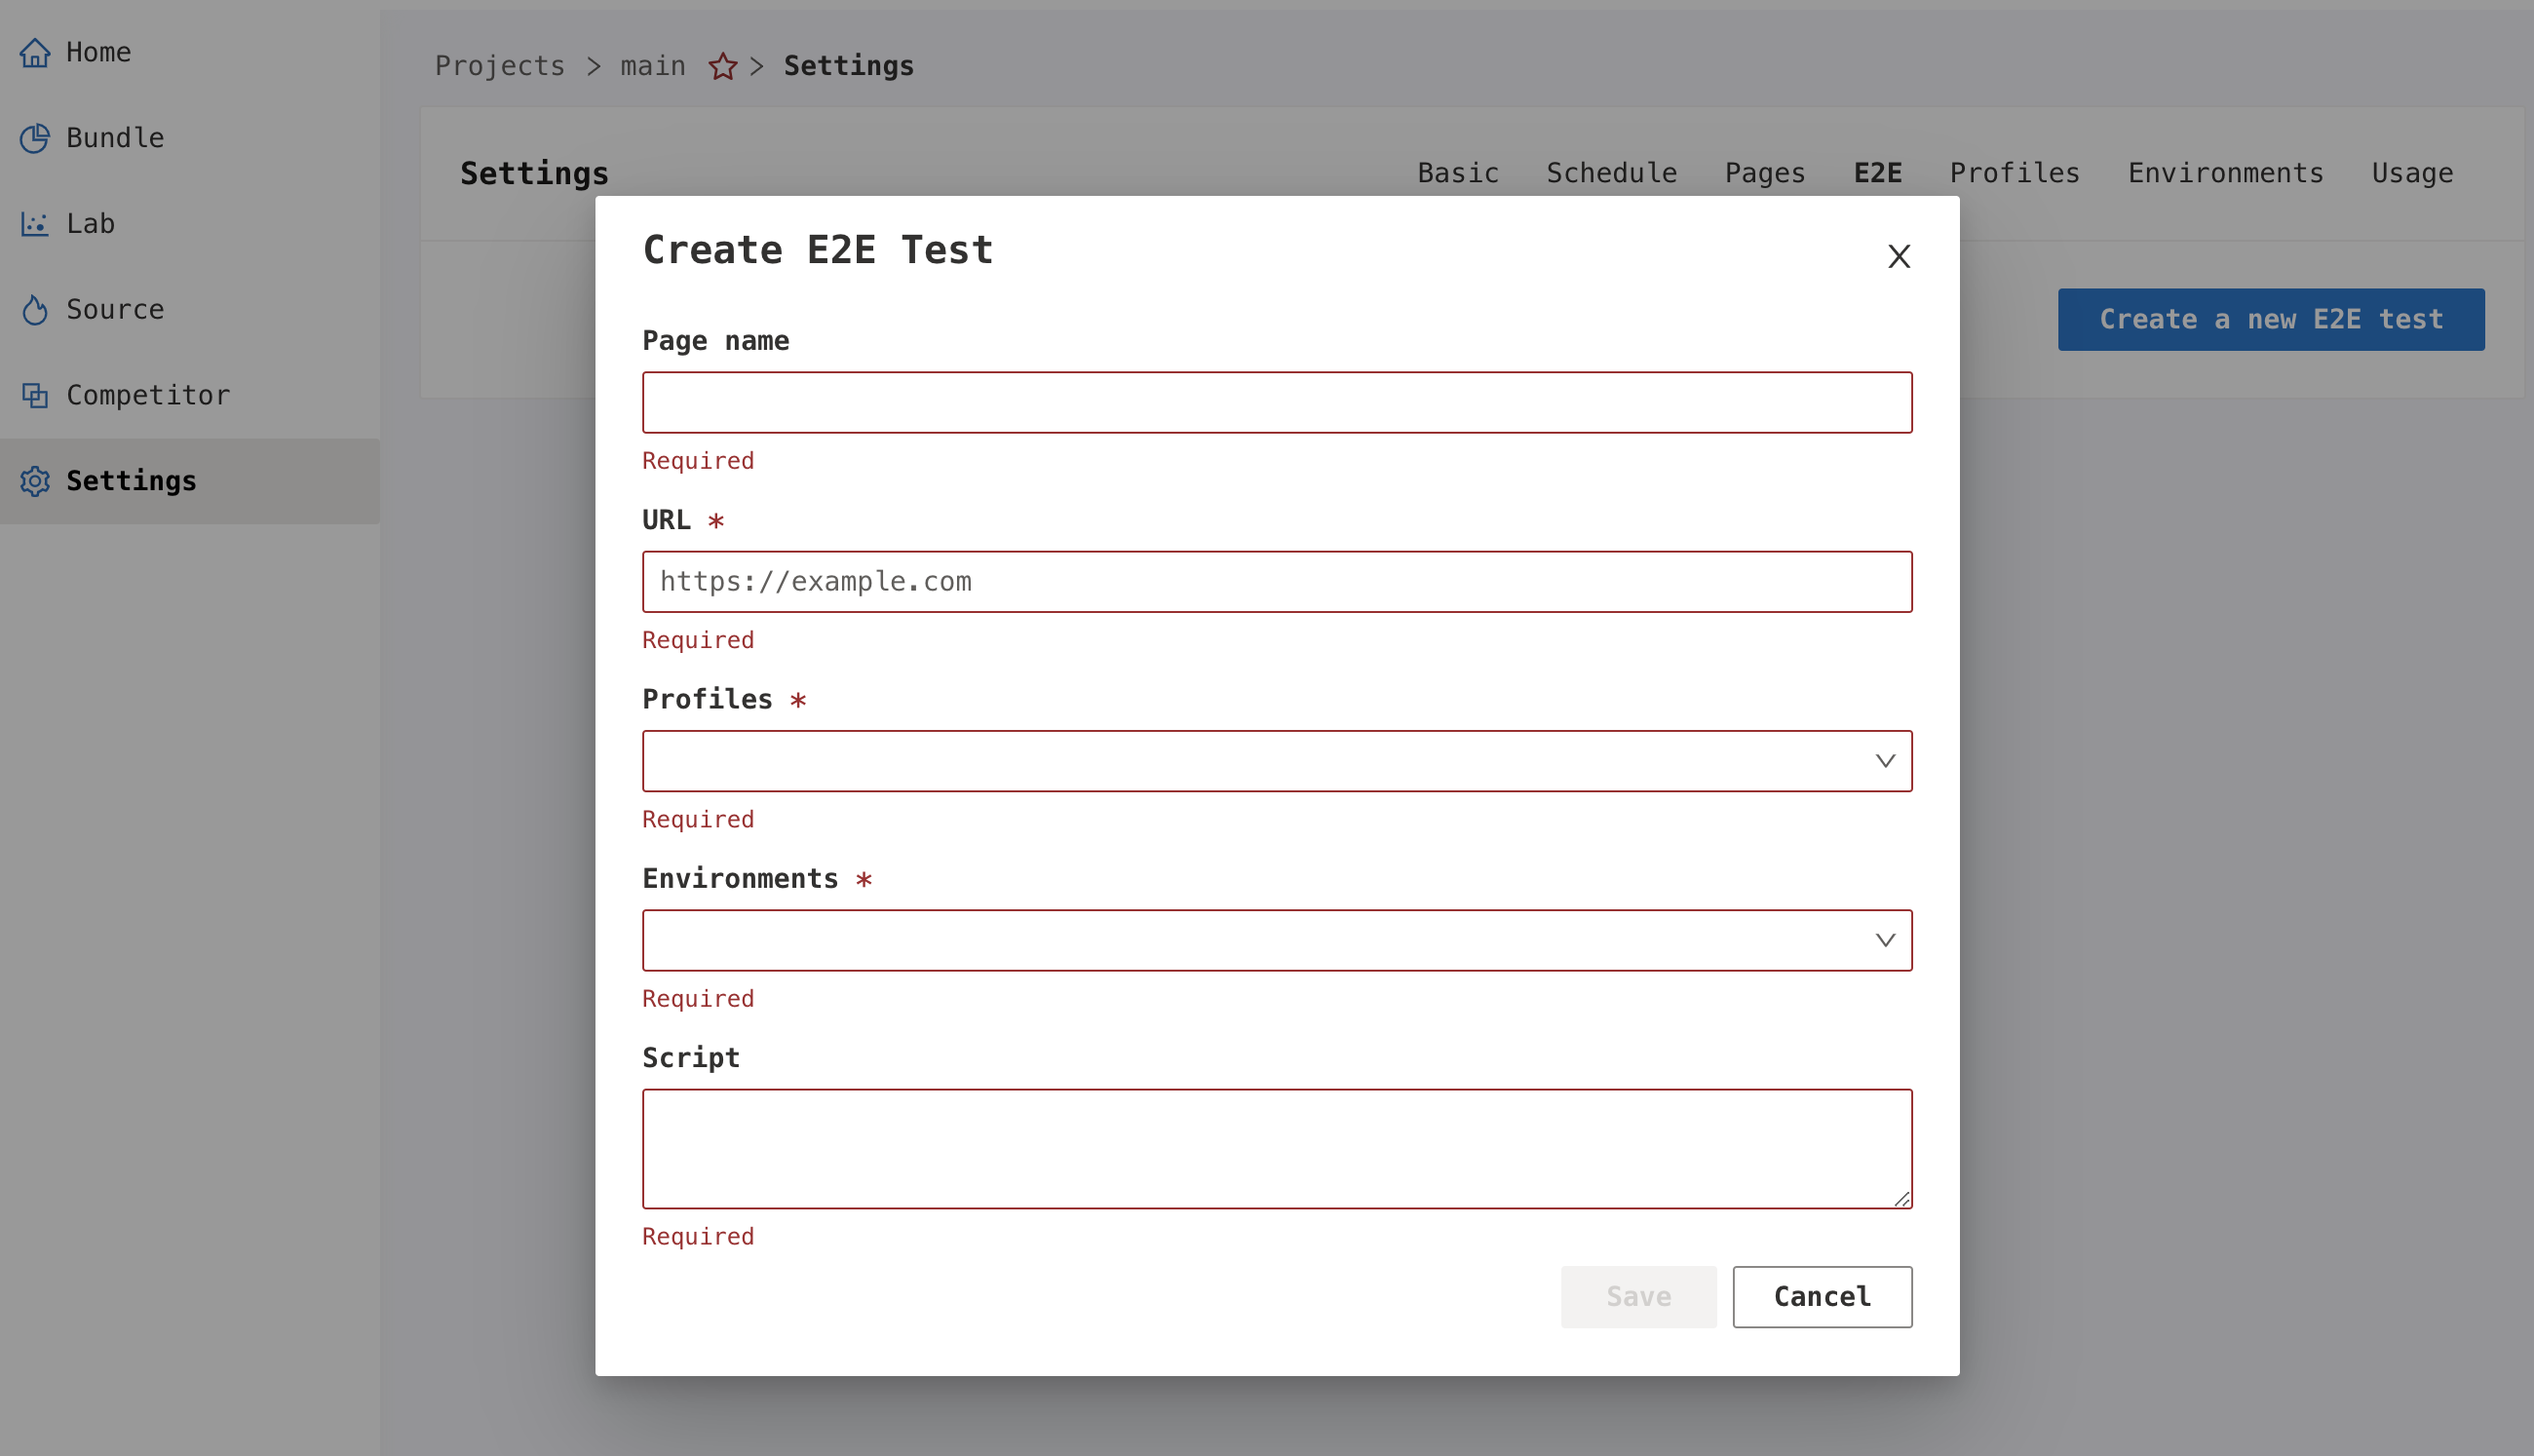
Click the Create a new E2E test button to create an E2E page.
As E2E is still in the experimental stage, the entrance is not open, you can enter it manually in the address bar: settings/e2e

E2E page configuration is the same as the normal page, refer to Pages Configuration for more details.
Step 2: Write E2E Test Scripts
This platform uses puppeteer to run E2E tests. E2E scripts are compatible with most common puppeteer APIs.
E2E testing environments
A Puppeteer instance is created in advance of running the E2E script, open the browser, create a tab, and the Profiles and Environments configured on the platform are automatically injected into the browser tab. The tab is injected into the script environment global variable page. The E2E script only needs to call the methods on page to operate it. See puppeteer class-page API for more methods.
Example
await page.goto('https://a.b.c/')

// Click on the div with the classname ms-list-cell and containing appmonitor/main

const [project] = await page.$x("//div[contains(@class, 'ms-List-cell') and contains(., 'appmonitor/main')]")

await project.click()

// wait for redirection

await page.waitForNetworkIdle()
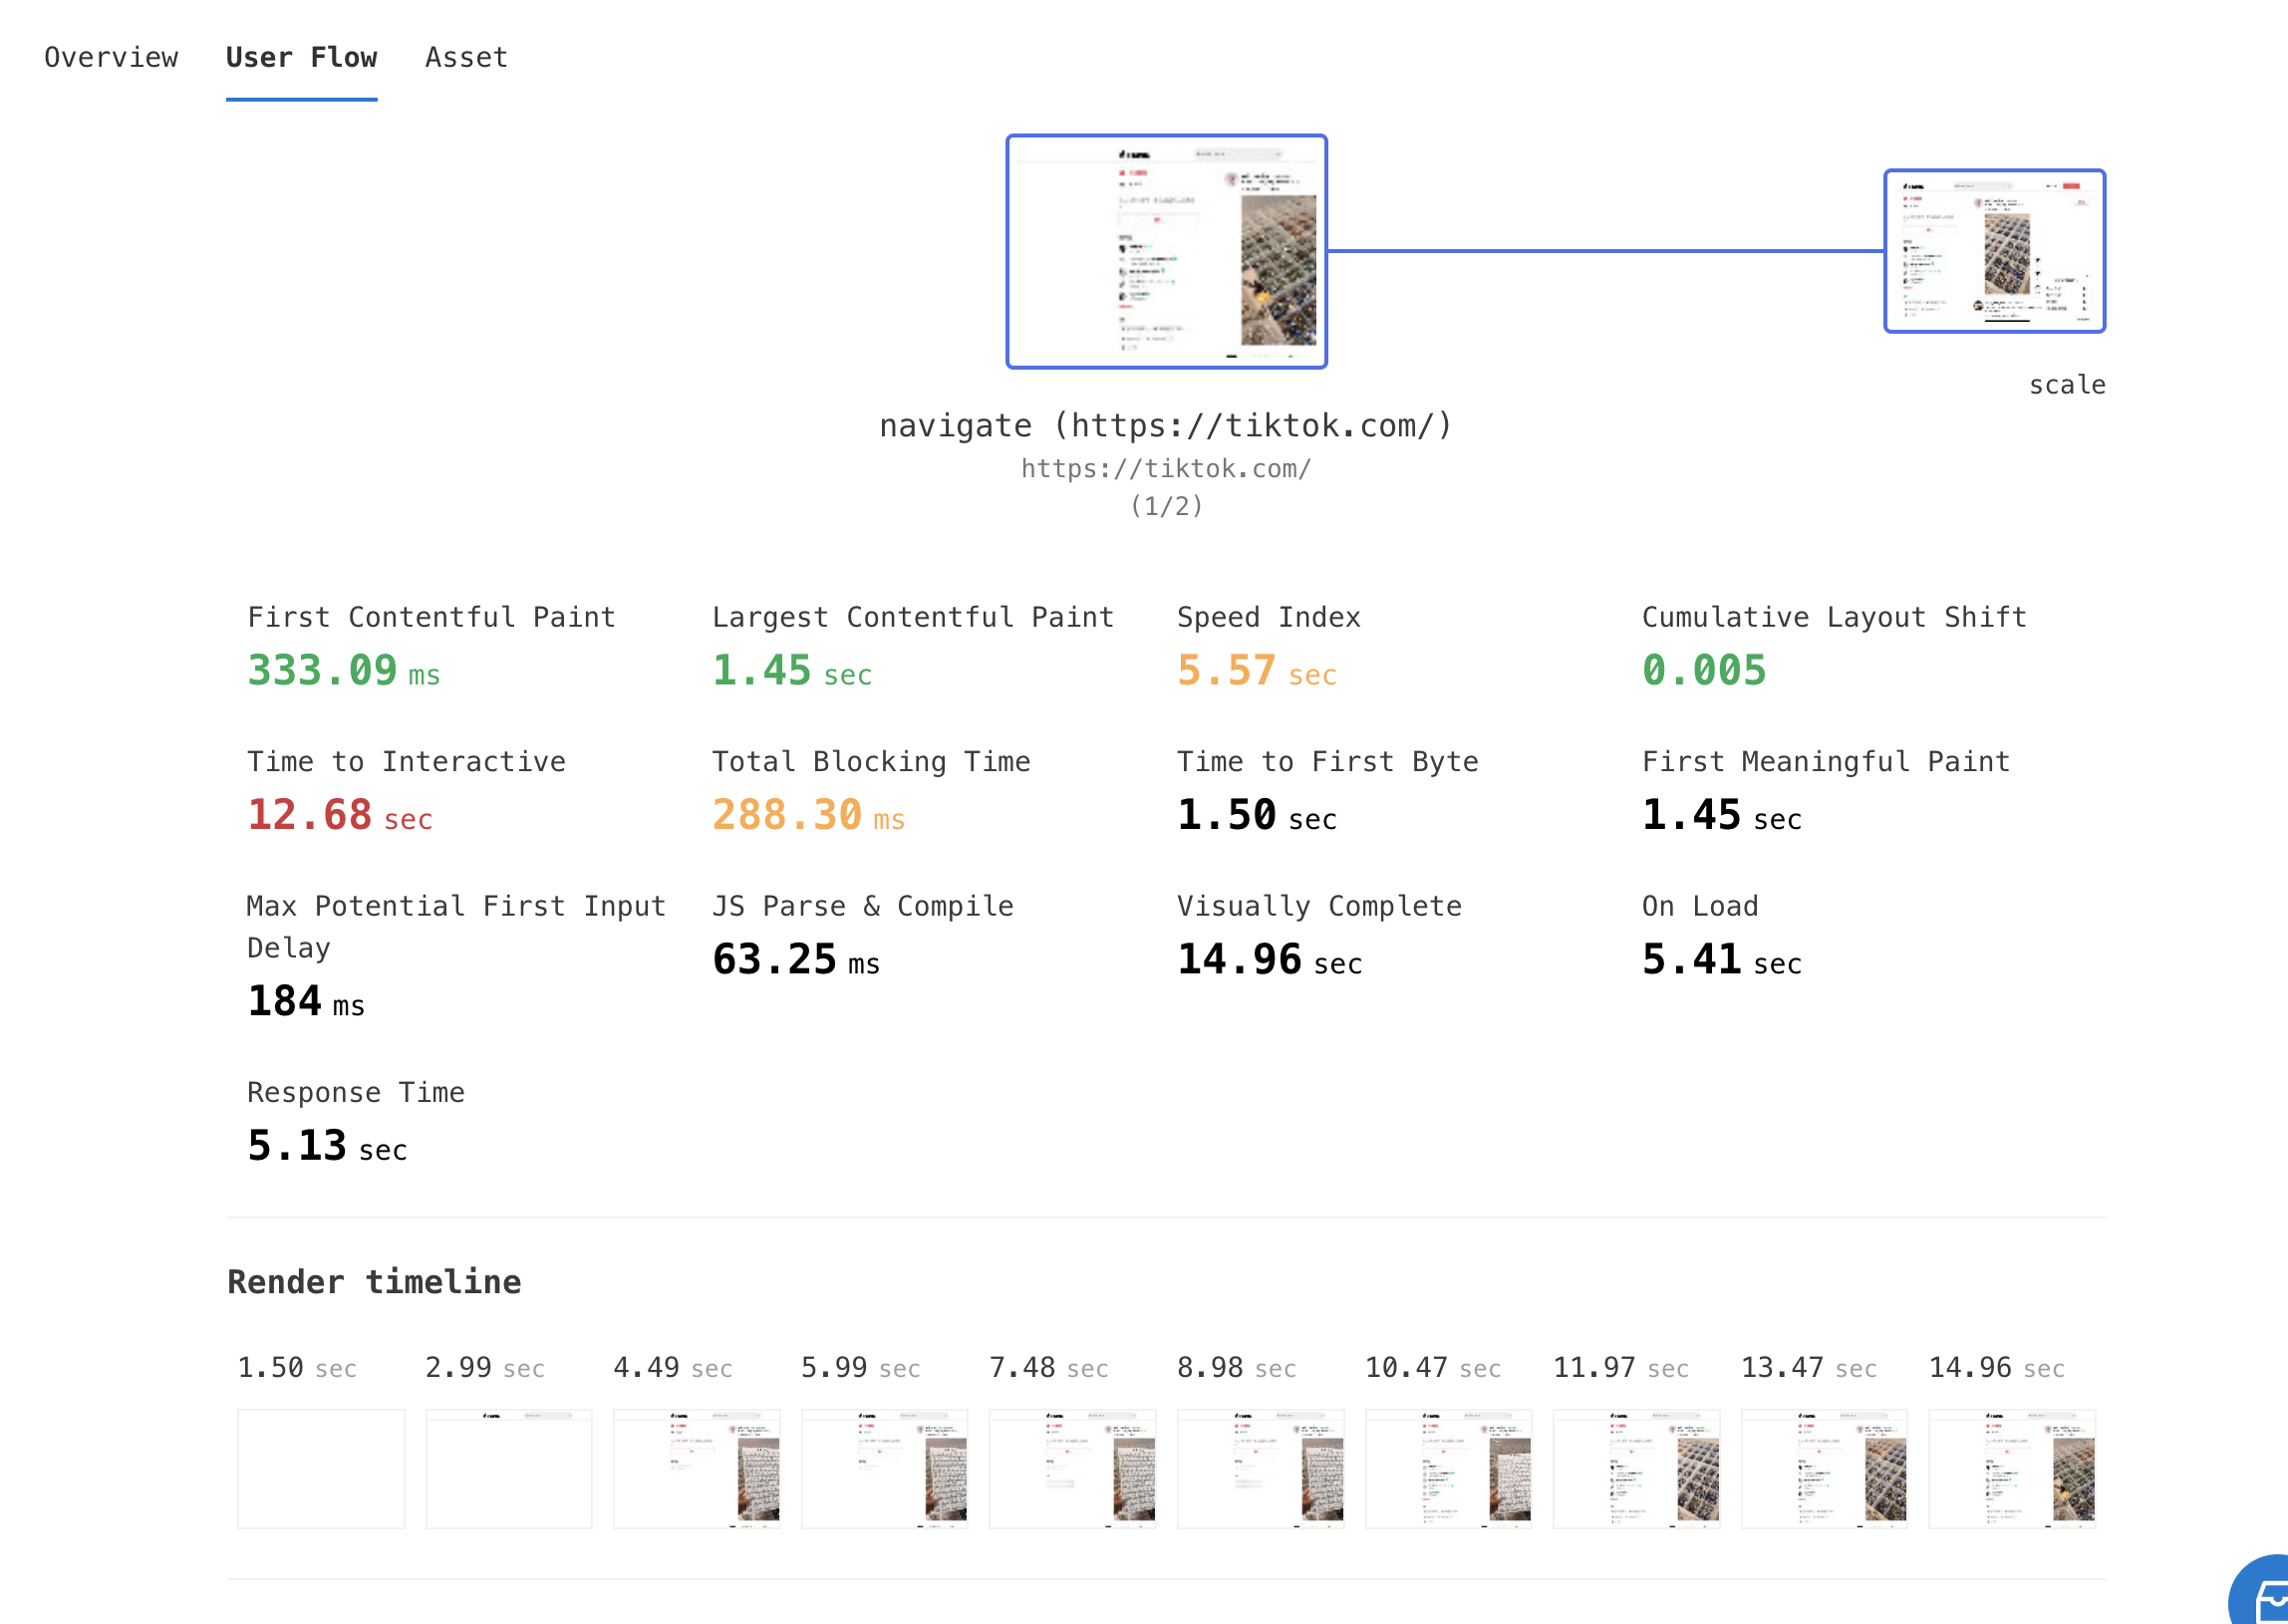
User Flow
In order to analyze the performance metrics of user actions at runtime, such as time spent per redirect, response time per click, etc., we divide the entire script into Steps, each of which generates performance metrics.
A Step is automatically started when the following actions are triggered in the script.
- goto
- reload
- goBack
- goForward
- click
- focus
- hover
- select
- tap
- type
- All methods of class Mouse
- All methods of class Touchscreen
- All methods of class Keyboard
- drag&drop of class ElementHandle
If you want to combine multiple actions into one Step, such as mouse press, move, and then release to simulate a drag operation, you need to use the startStep and endStep methods on the global object flow.
Example:
await flow.startStep('<Step Name>')

await page.mouse.down()
await page.mouse.move(0, 100)
await page.mouse.move(100, 100)
await page.mouse.move(100, 0)
await page.mouse.move(0, 0)
await page.mouse.up()

await flow.endStep()
page.goto is a special Step that should not be called between flow.startStep and flow.endStep.
Step 3: Take an E2E Snapshot manually
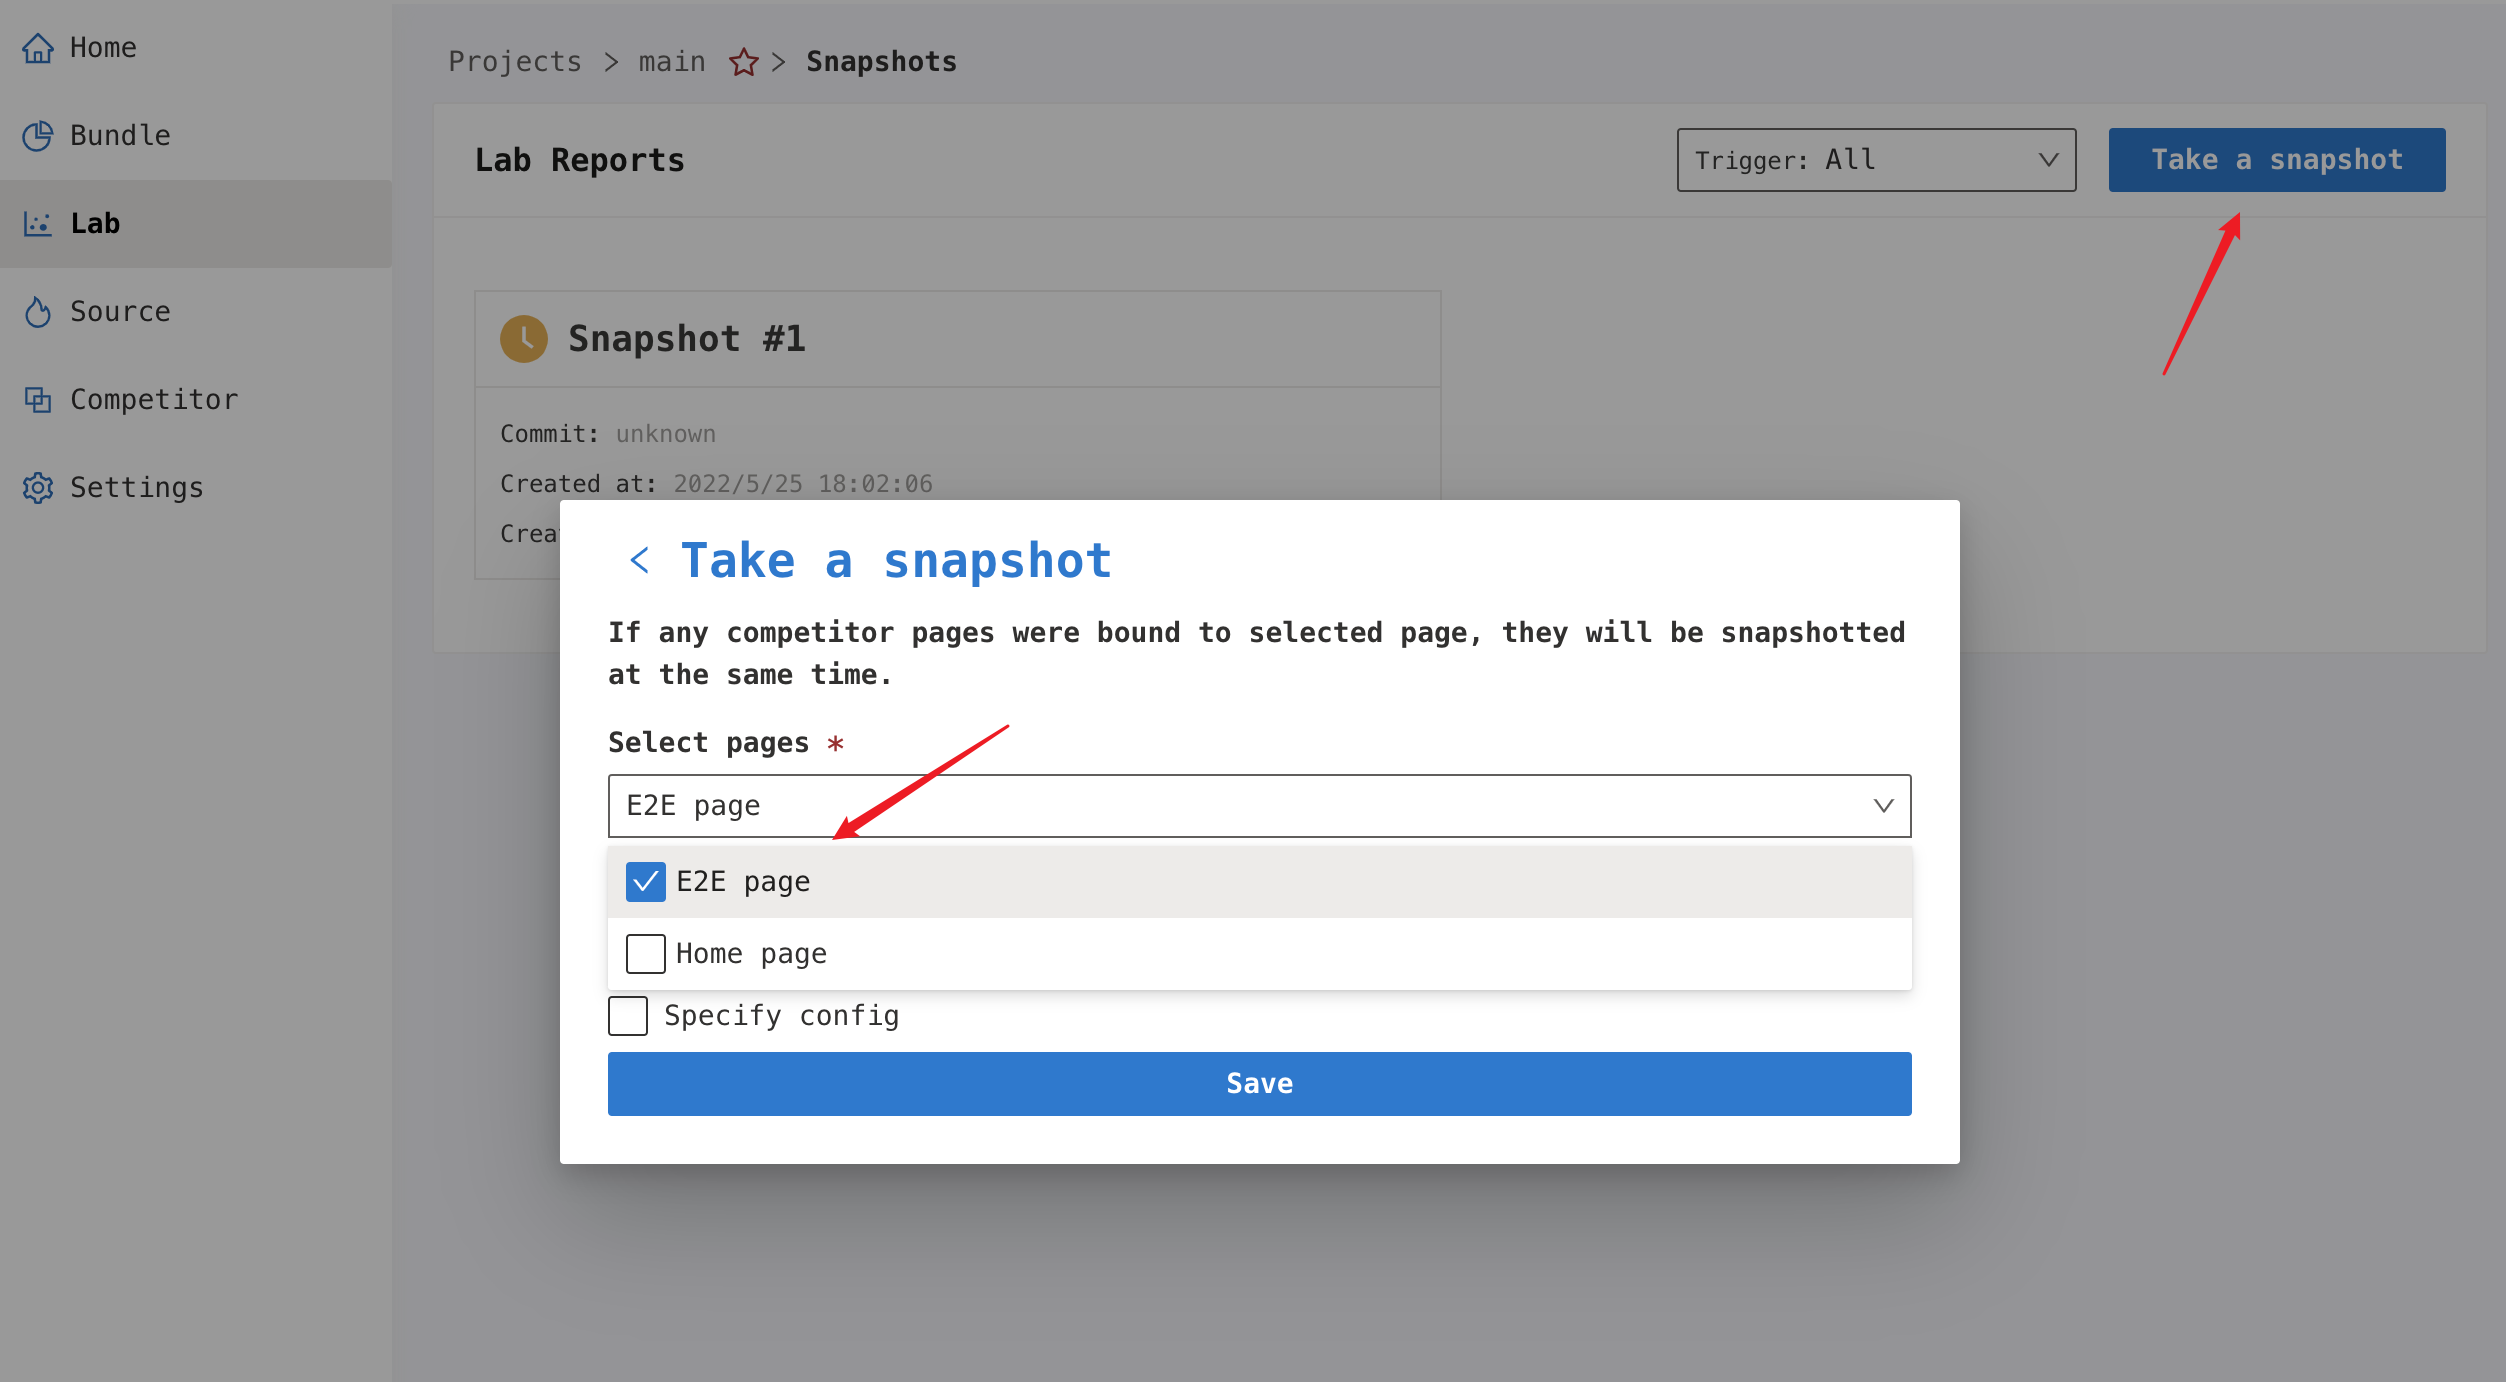
Navigate to Project→Lab and click the Take a snapshot button at the top right of the page to select the e2e page you want to test to trigger a scan.
Step 4: View the result
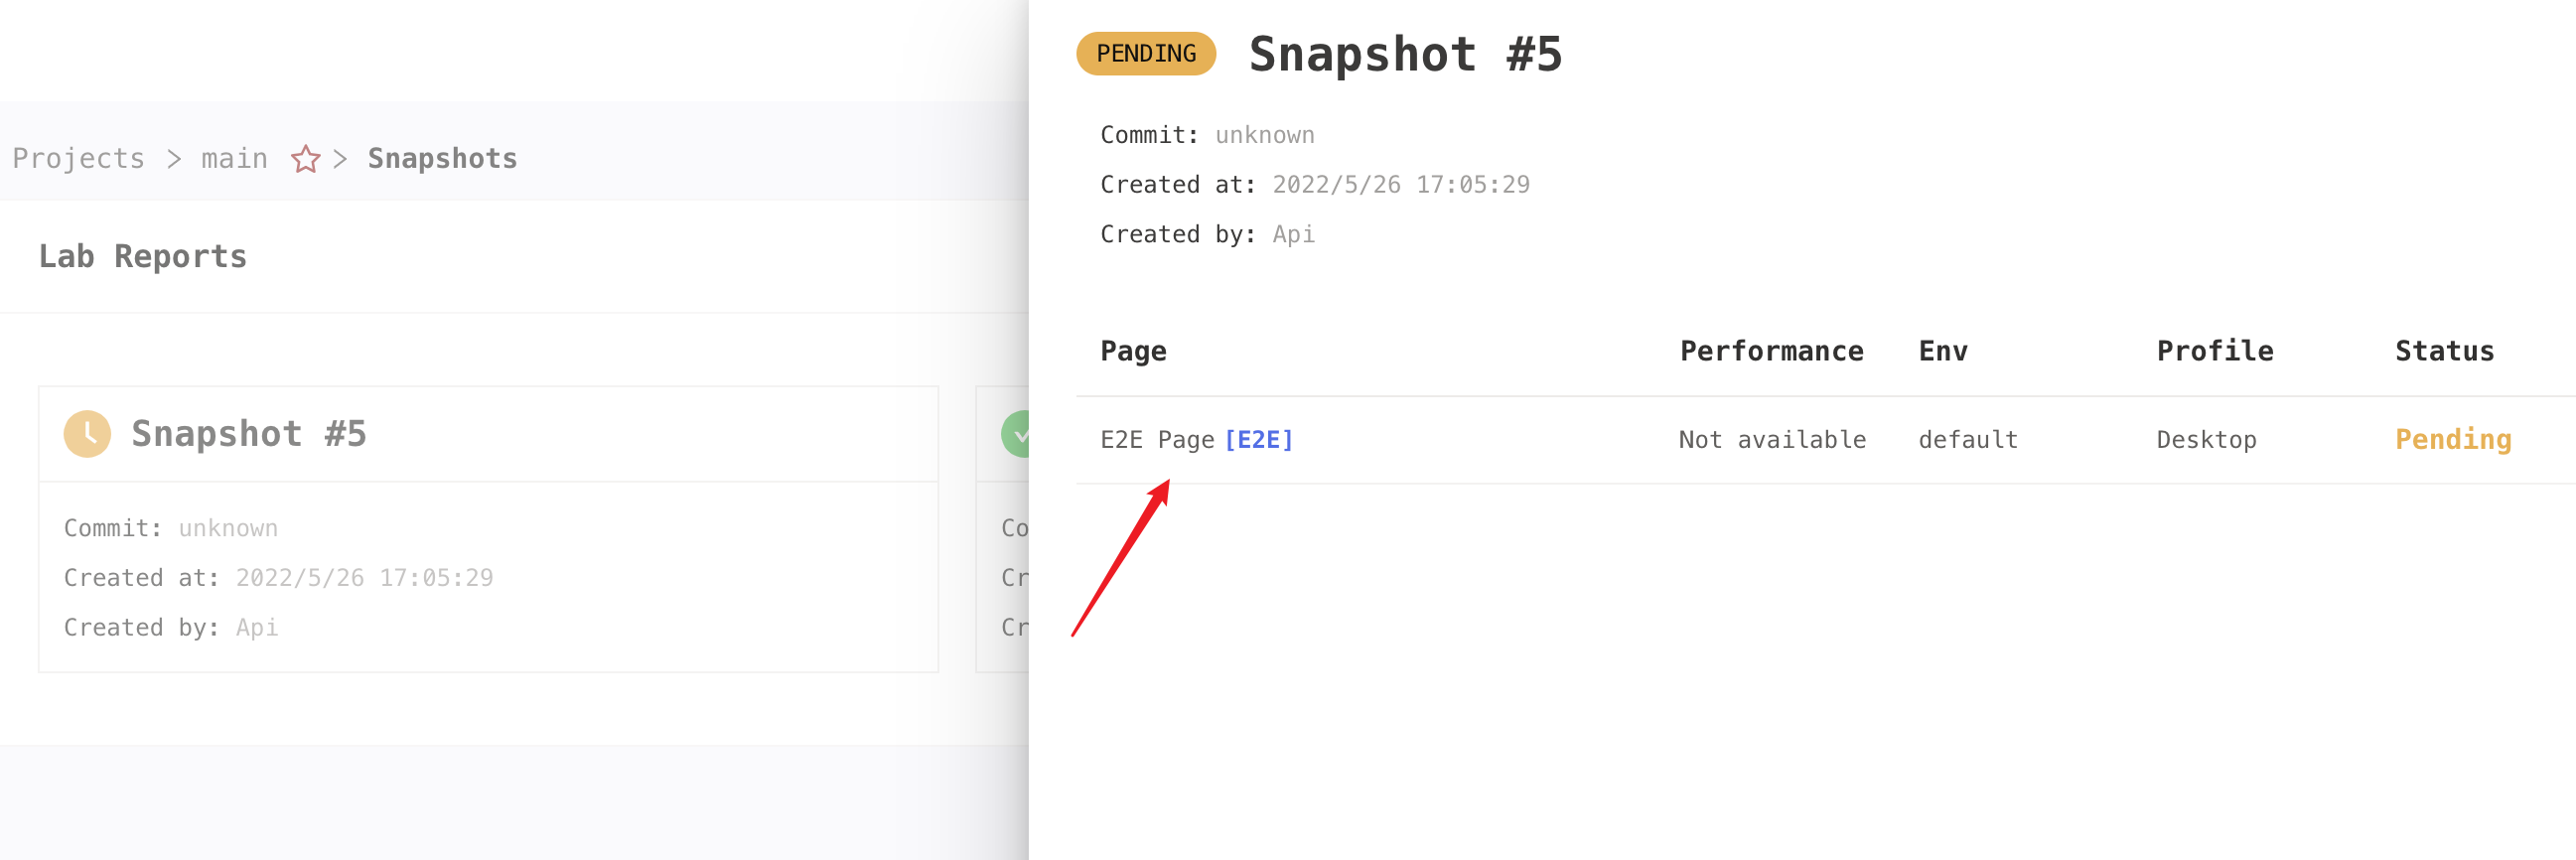
Clicking on the Snapshot card in the Lab module will display all the results of this run and click the page name to go to the report you want to view.
Overview
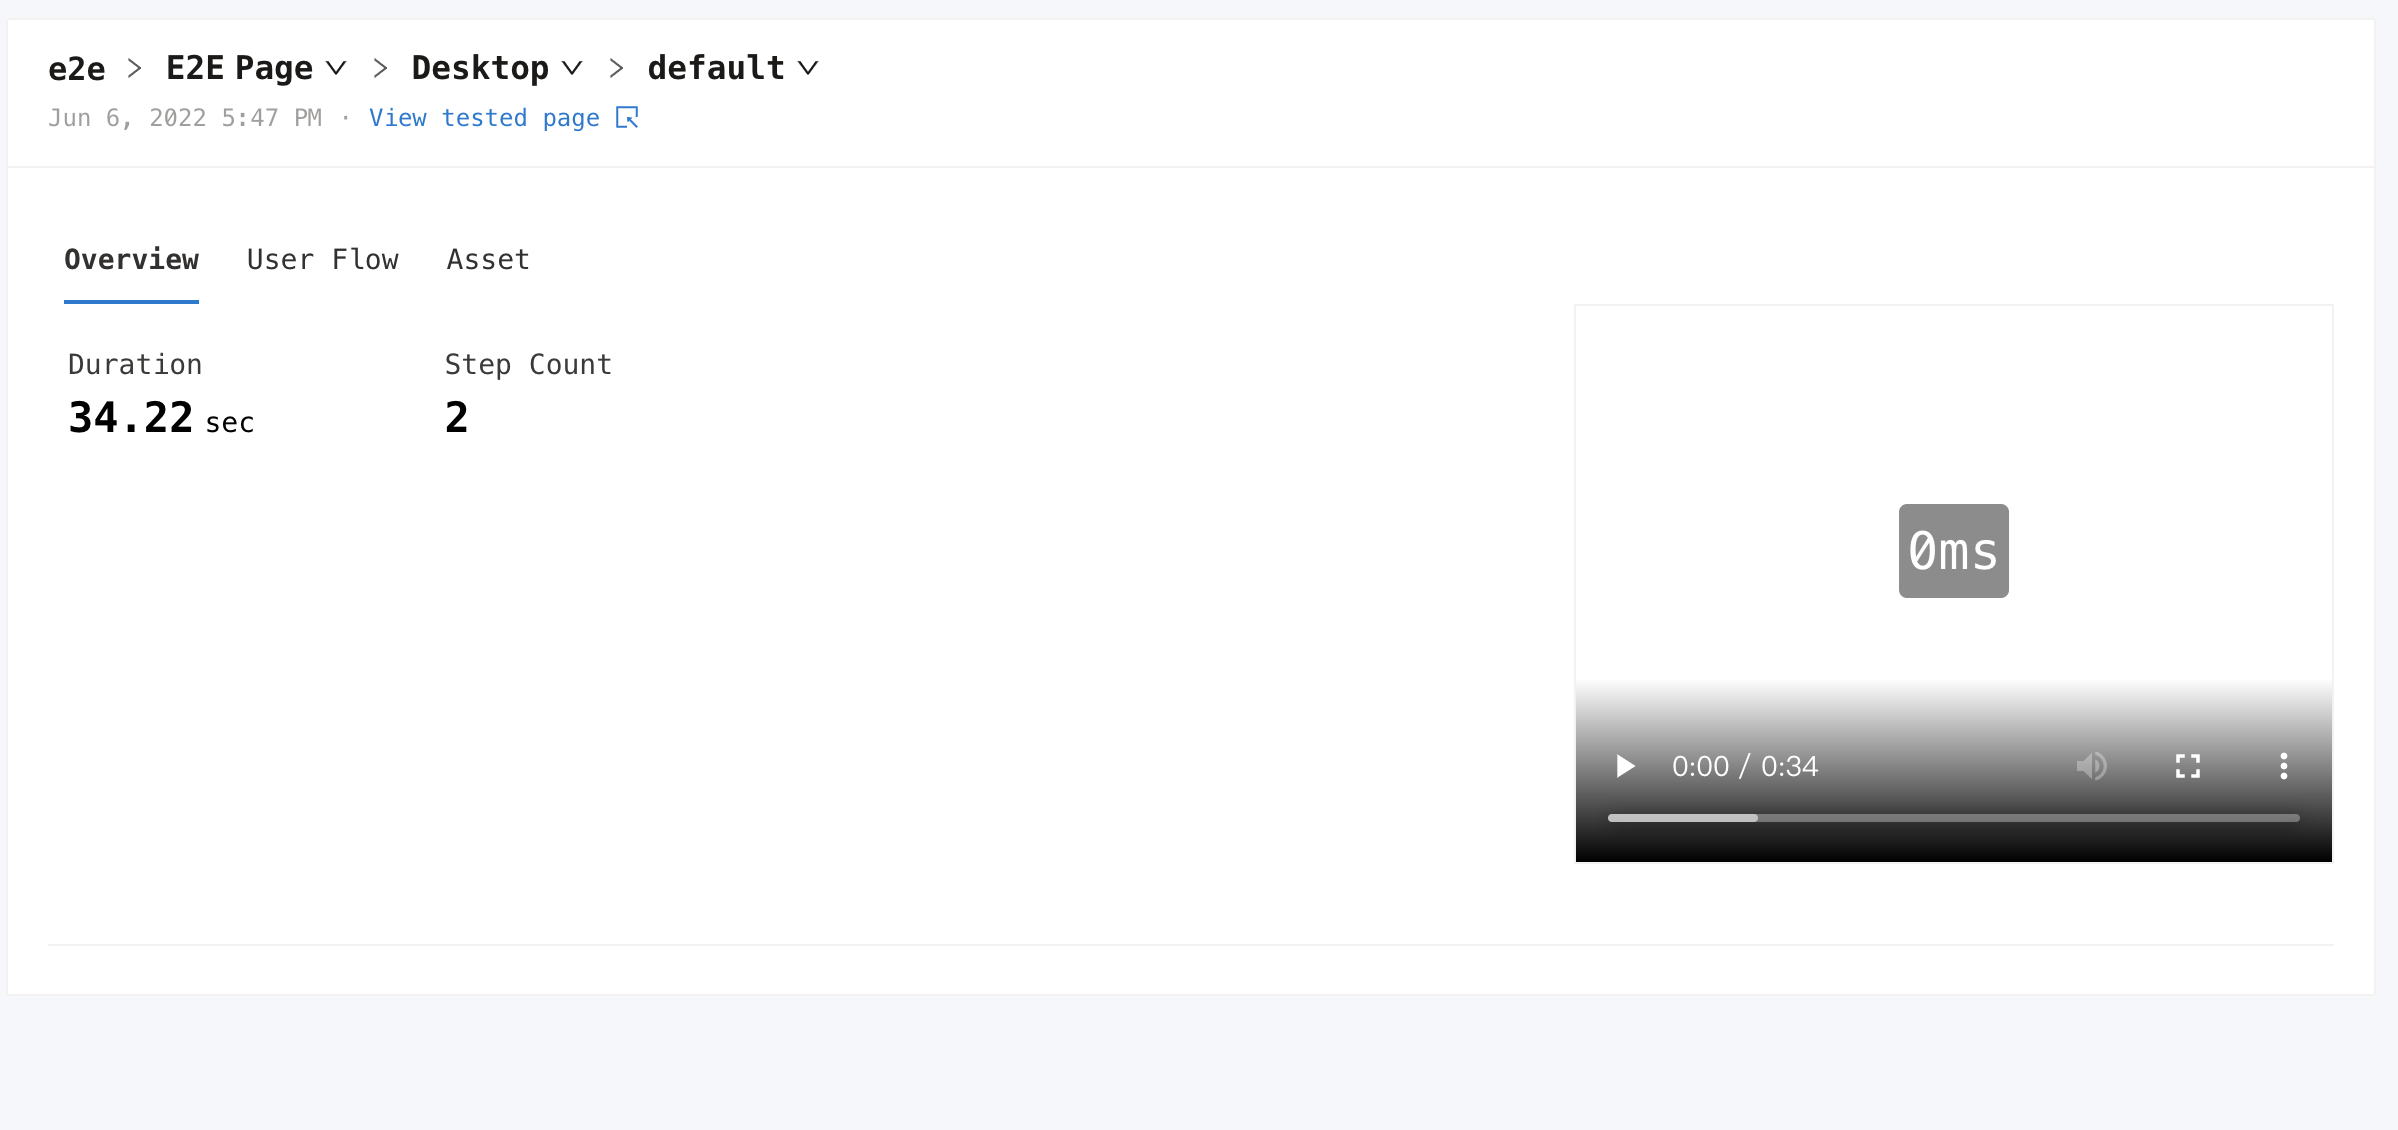
When you go to the report page, the time that is taken to run the analysis and the number of steps for this E2E script execution are displayed, as well as a runtime video.
User Flow
Click on the User Flow tab on the report page to see the performance analysis data and optimization recommendations for each step. Click on the thumbnail on the timeline to jump to the next step.
