Snapshot report
We call the result of the Lab performance analysis job Snapshot. Every snapshot contains all reports of URL picked with given env & profile. For instance, in a project configured with 5 pages and each page is related to 2 profiles, there will be 10 (5x2) reports for each snapshot.
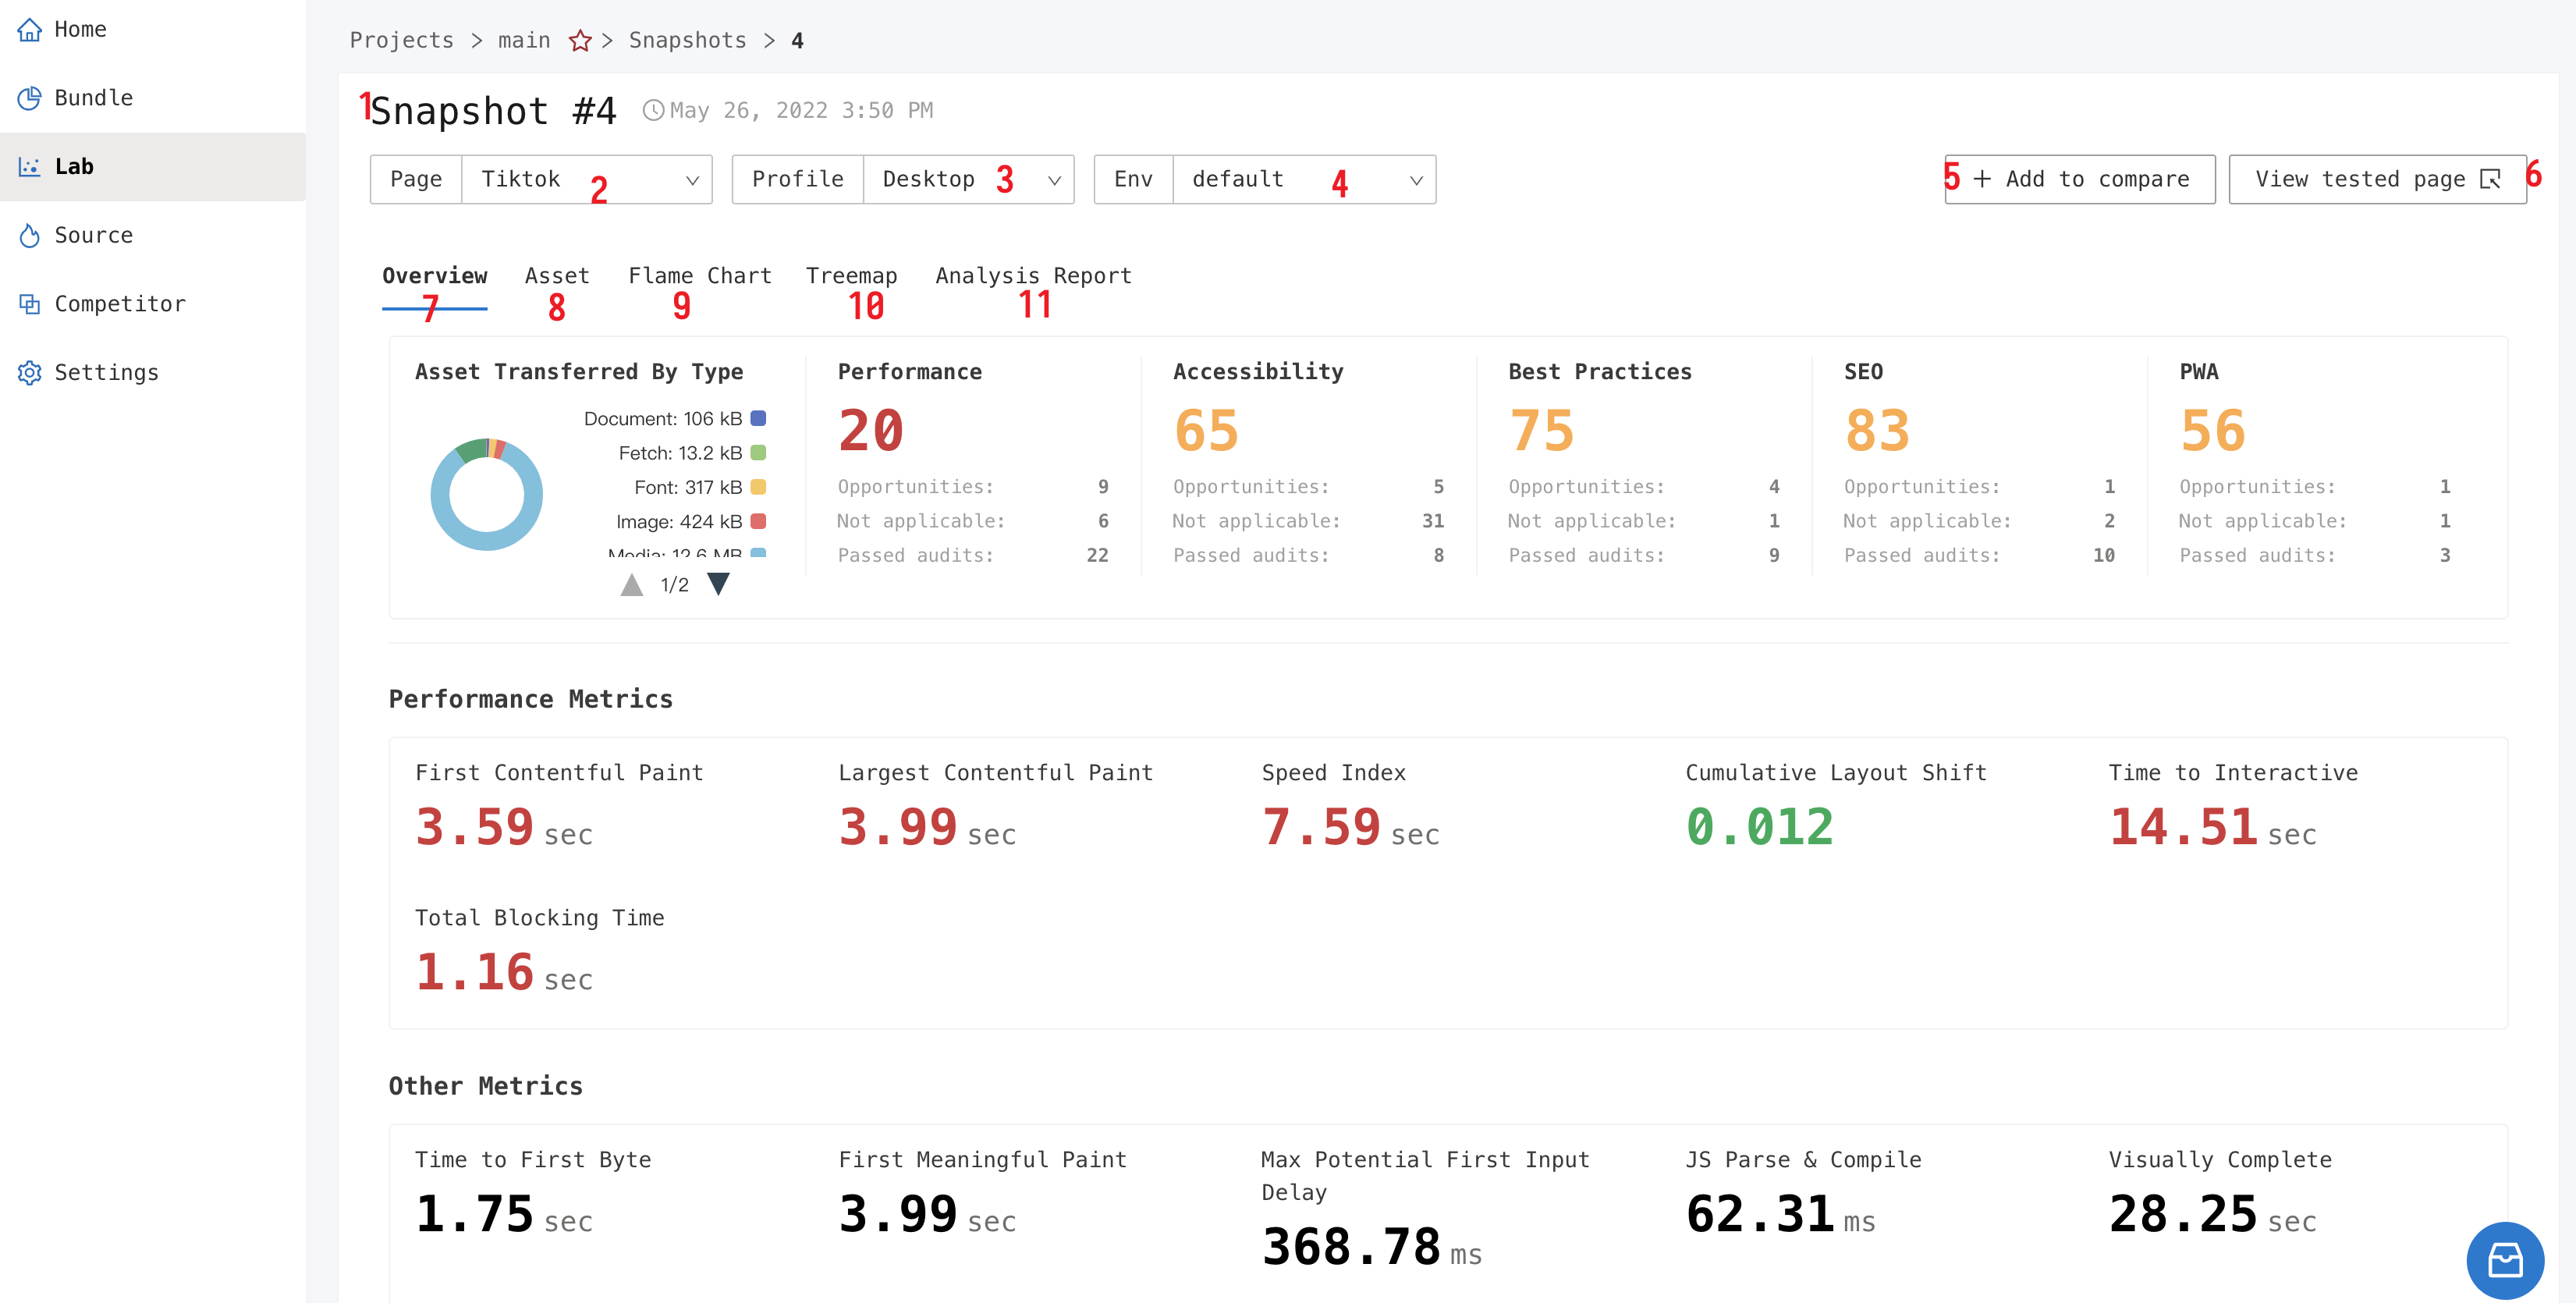
Function introduction corresponds to the marker serial number
1. Snapshot id or Snapshot title
2. Page switcher
3. Profile switcher
4. Environment switcher
5. Add this report to the multi-report comparison field
6. Open the analyzed page in a new tab
Overview
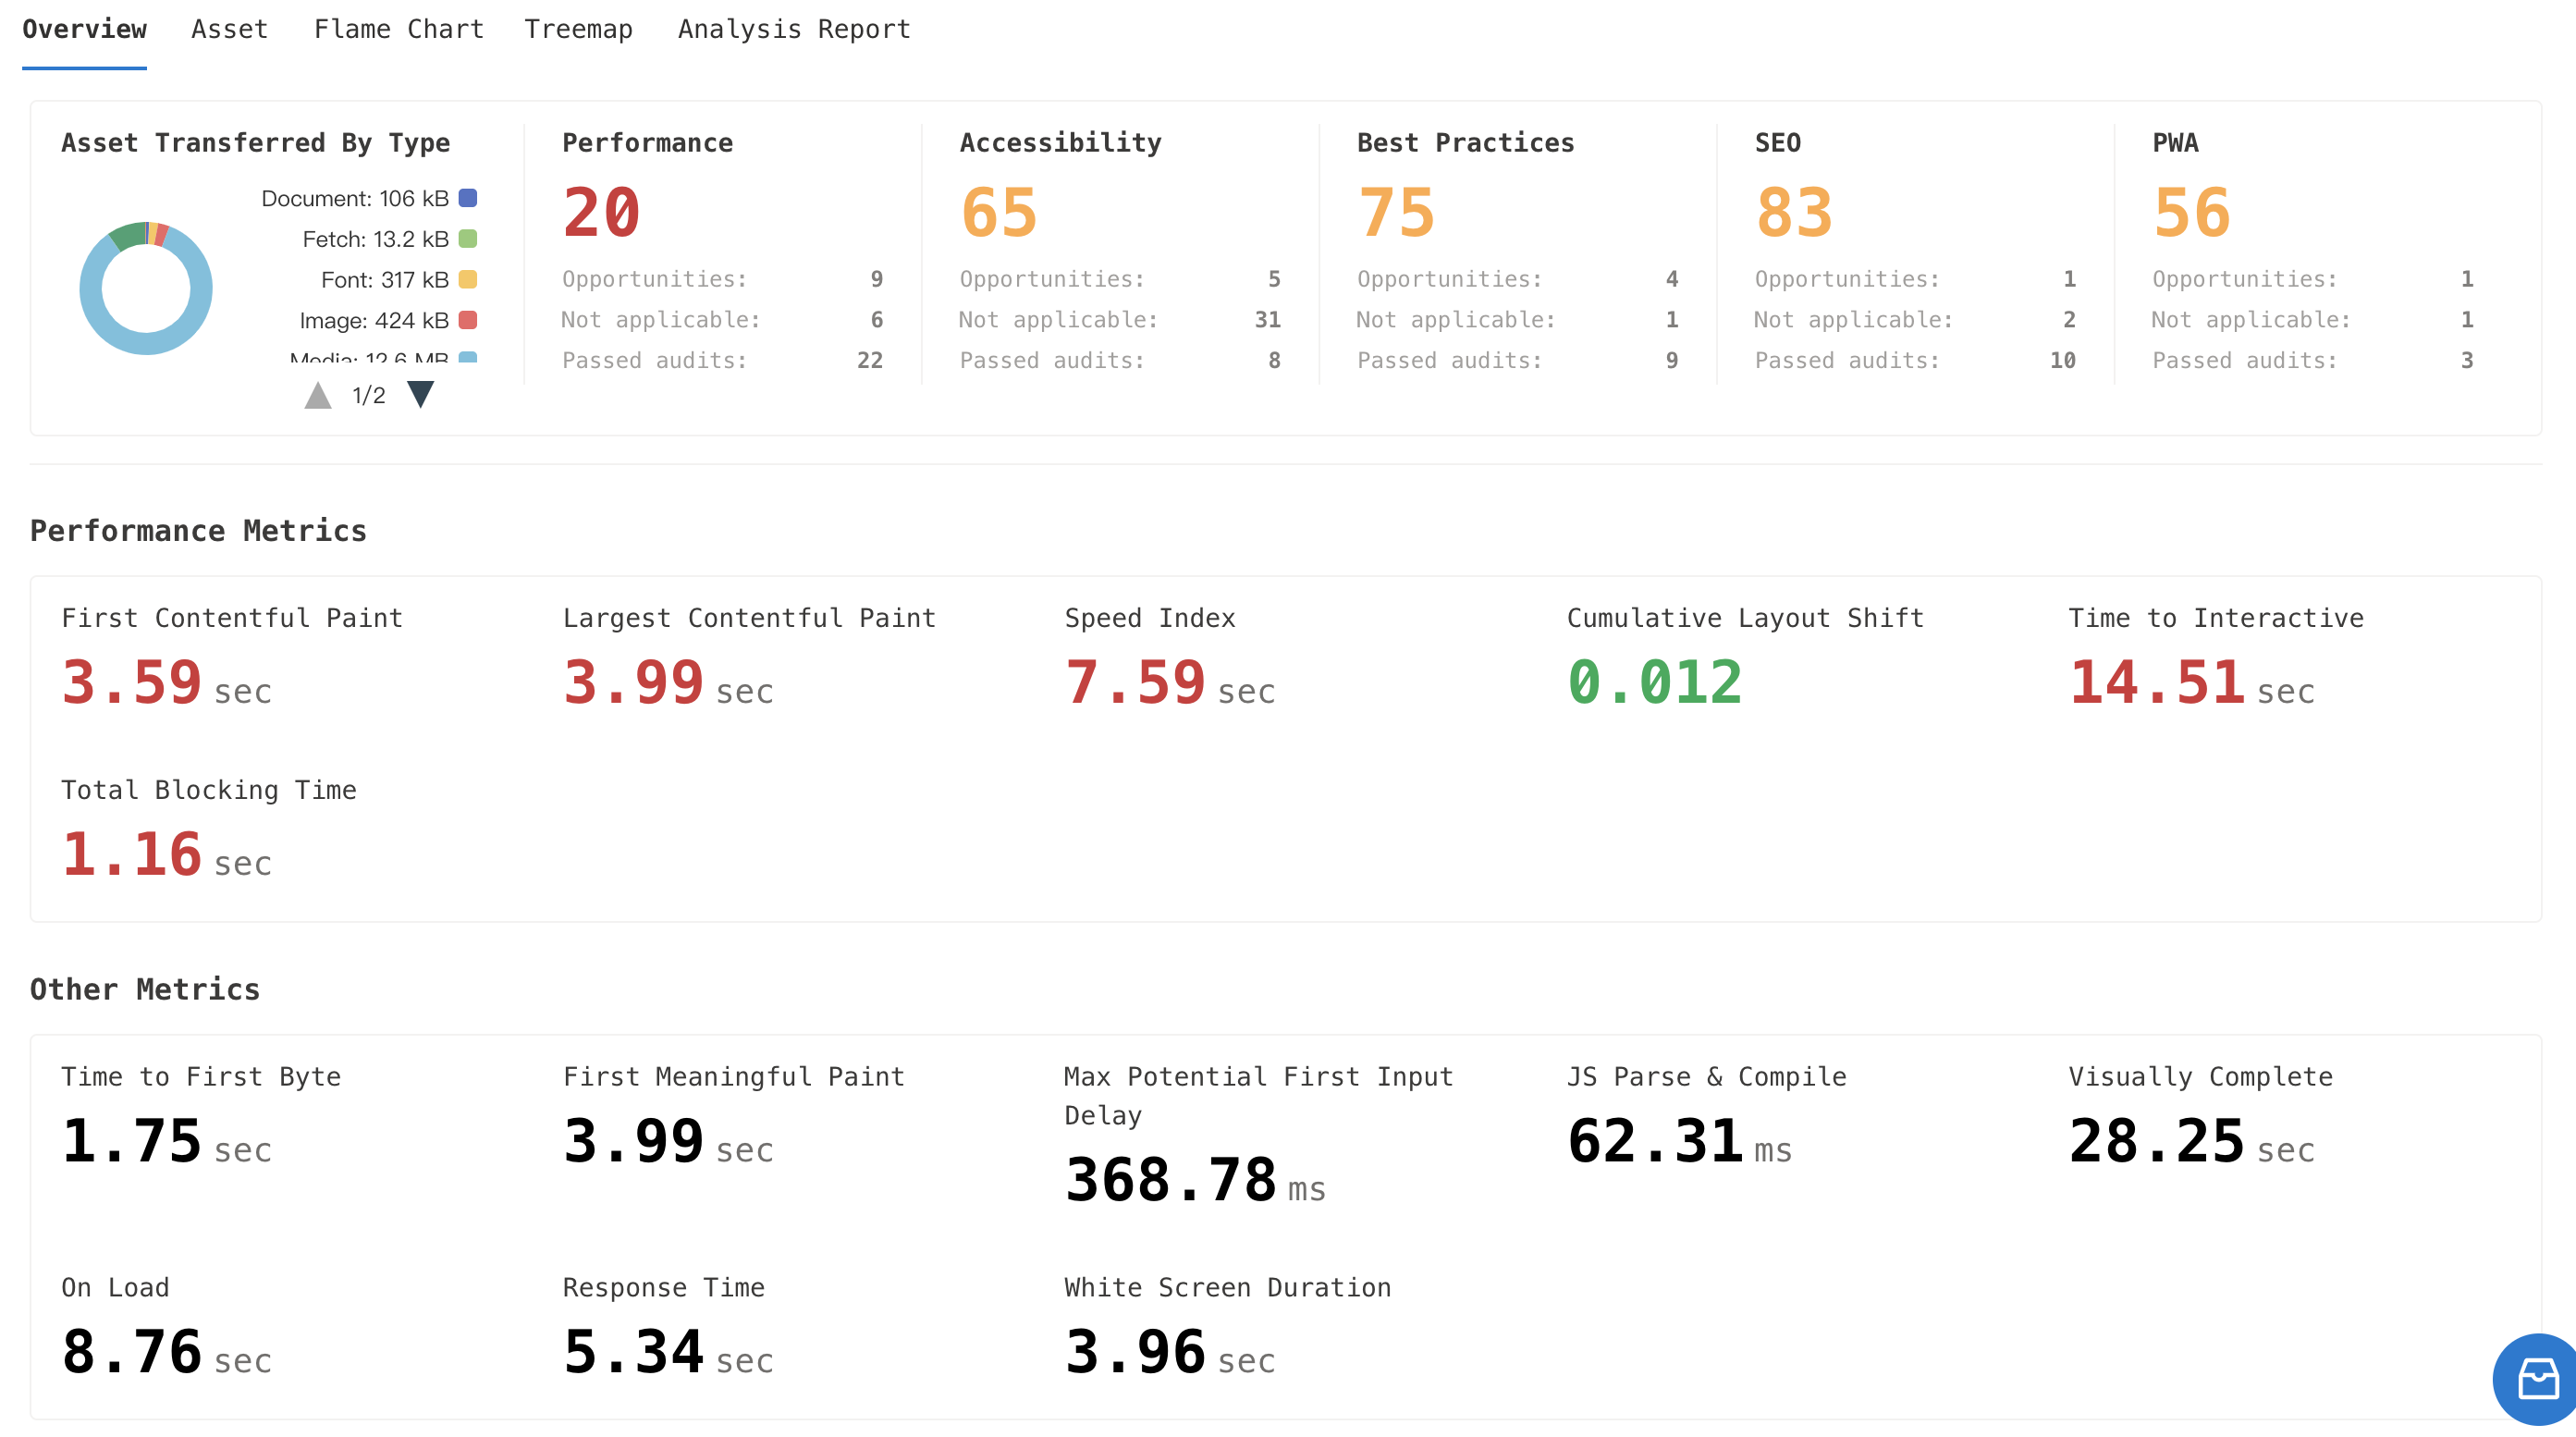
Snapshot Overview provides the most speed information:
- critical speed metrics (color-coded based on good, need improvement or poor readings)
- a pie chart of requested assets
- a render timeline
- a render video
- a JavaScript Main Thread Execution Timeline
Performance metrics:
The platform's reports will use different colors to mark the critical metrics, and the correspondence between the score range and the colors is as follows:
- 0 ~ 49 (red): Slow
- 50 ~ 89 (orange): Average
- 90 ~ 100 (green): Fast
Rendering process
Click on the "Render Video" button on the right and it will display a video of the rendering process.

Main Thread Execution Timeline:
With the Main Thread Execution Timeline, it’s possible to pinpoint long-running and blocking JavaScript tasks.


Finding long-running tasks before critical time points such as FMP/TTI is an effective means of optimization.
Assets
The requests can be inspected in great detail to find speed bottlenecks.
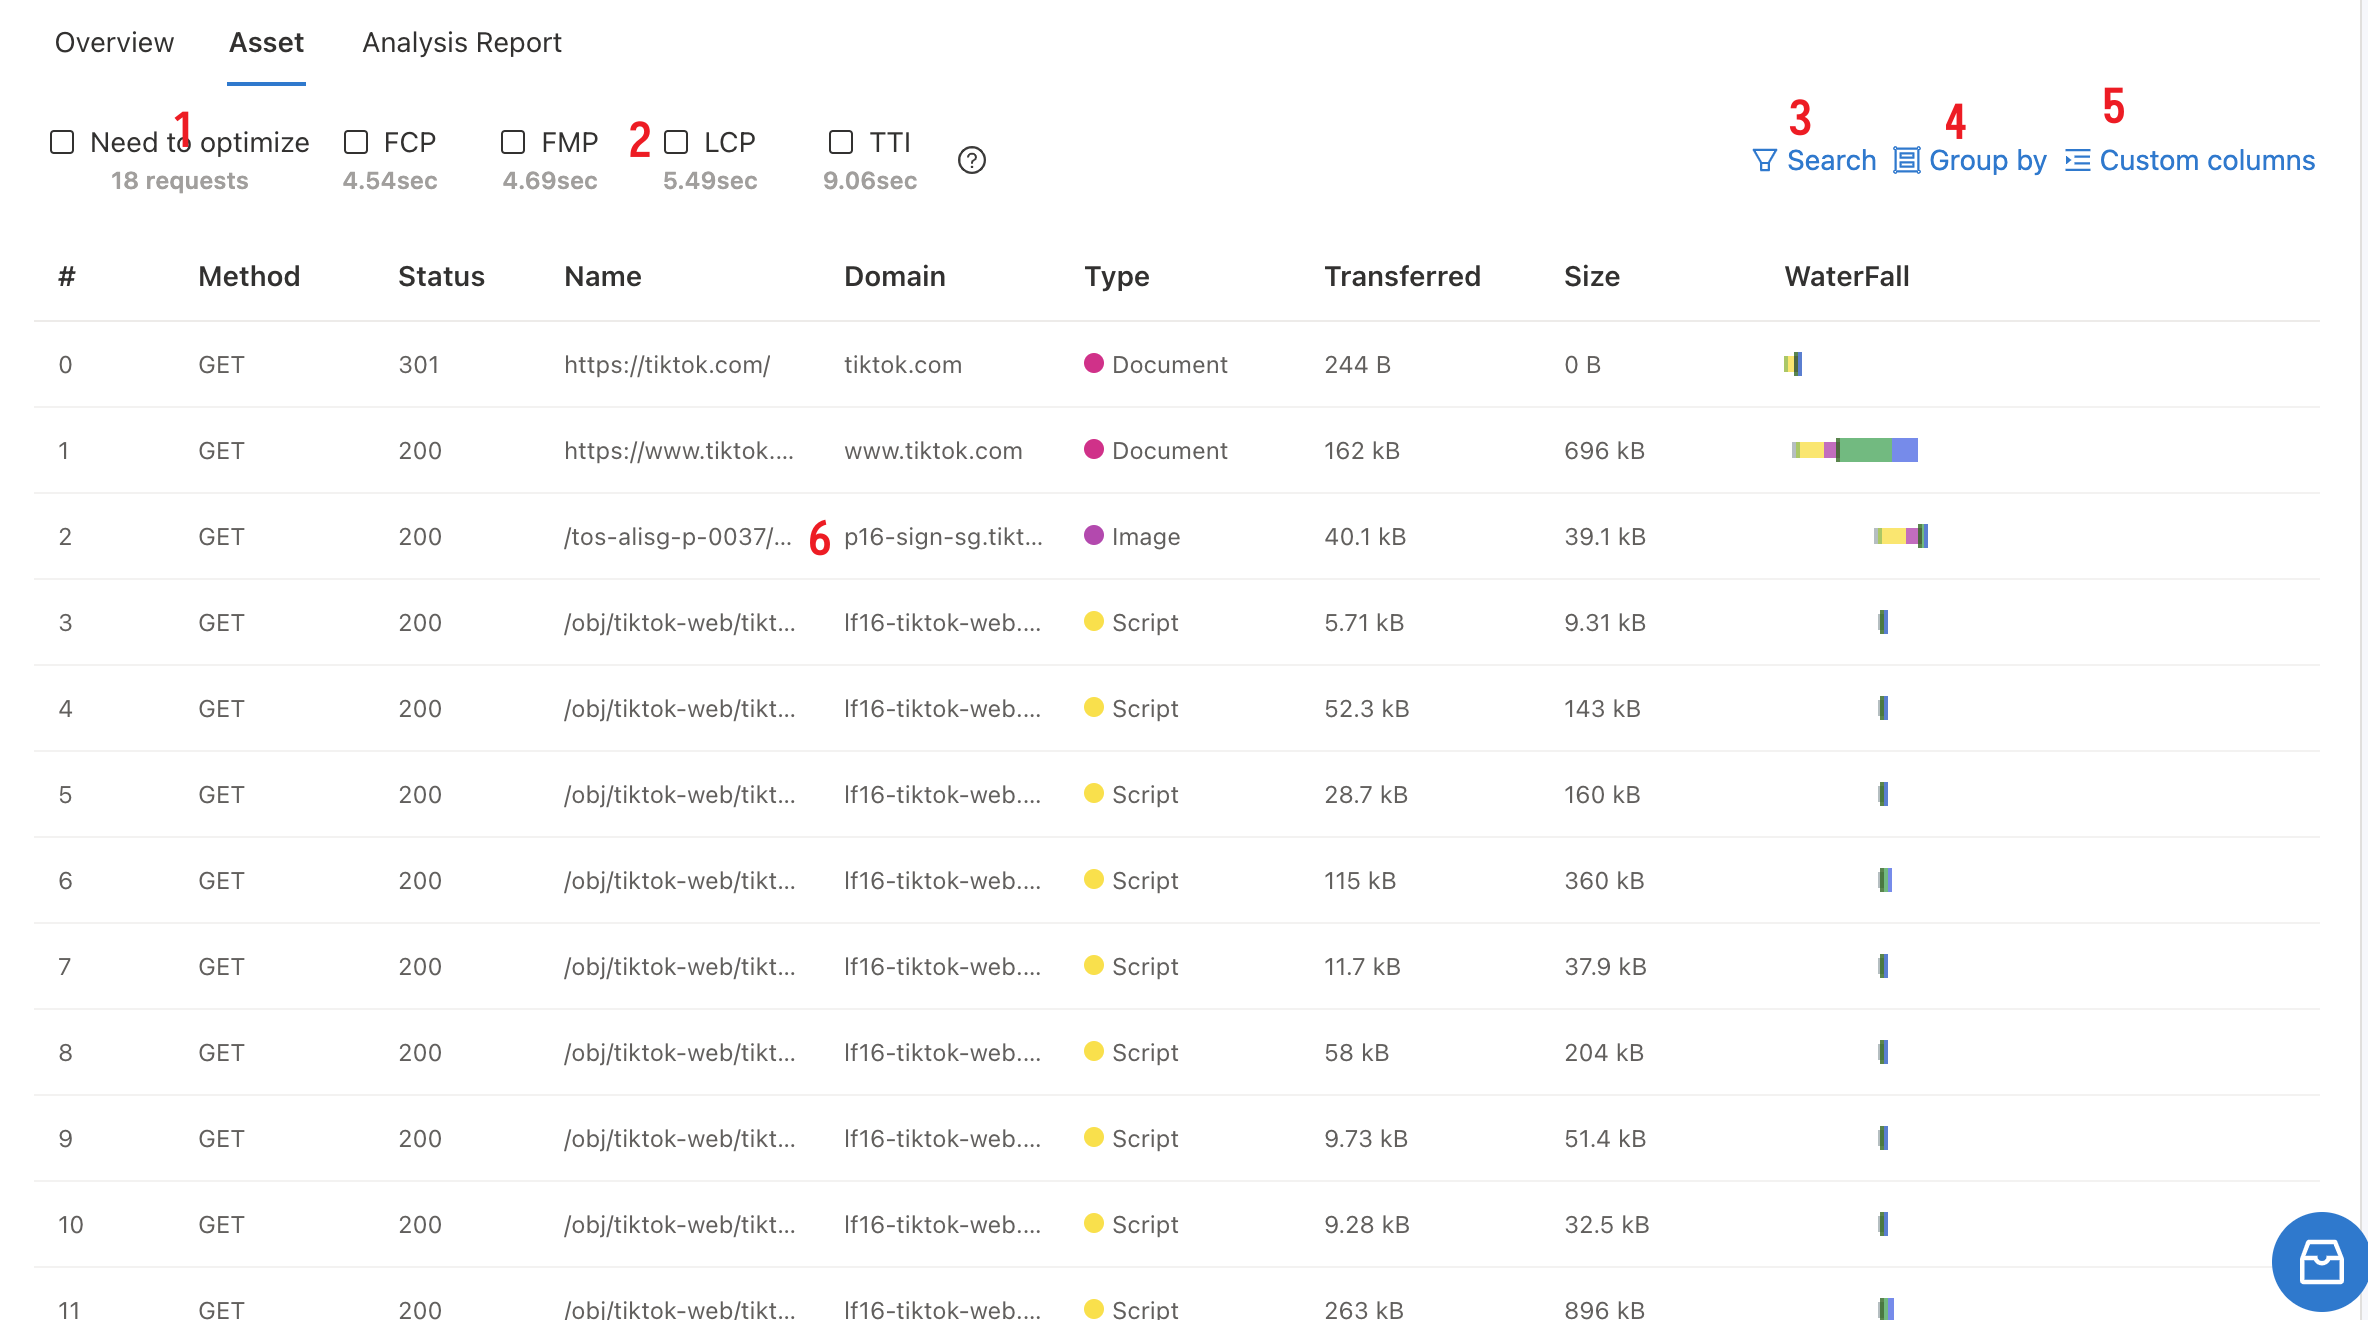
1. Filtering requests that can be optimized
Filter out requests that can be further optimized based on rules such as whether Gzip is properly enabled, whether caching is properly enabled, resource volume size, request time, etc.
2. Filtering requests by key time points
It helps us to quickly find the resource loading situation before the key time point (FCP/FMP/LCP/TTI).
3. Search url
4. Group requests by [type, domain...]
5. Custom table columns
6. Request detail
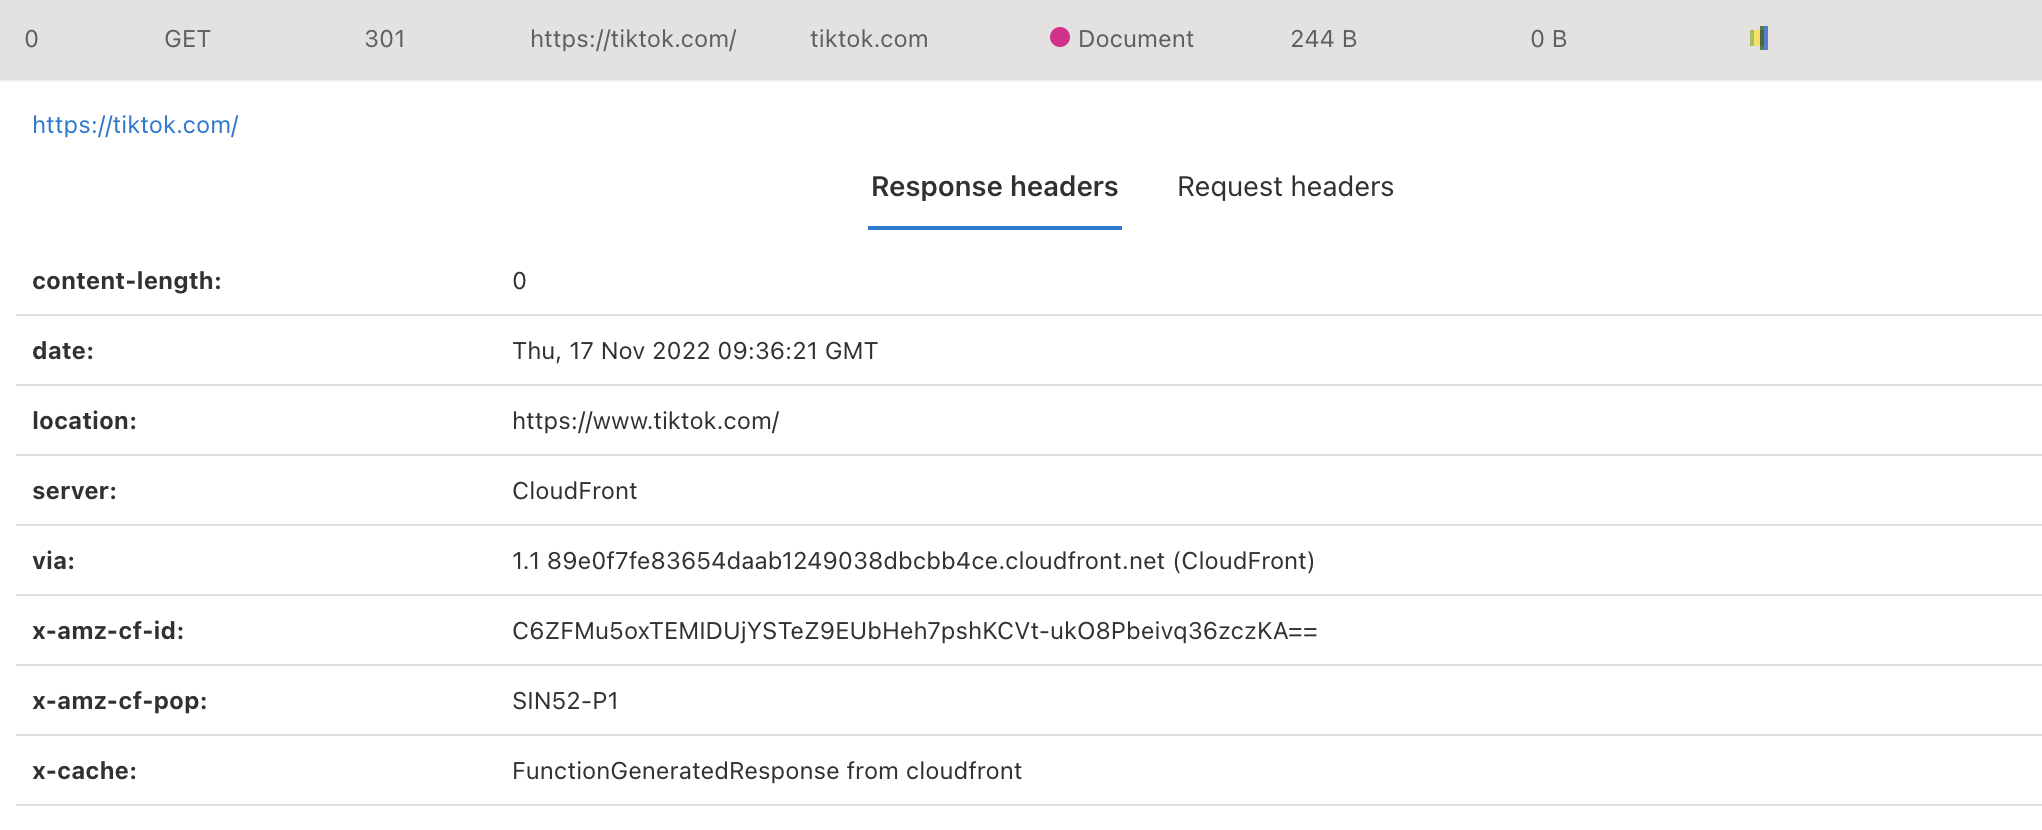
The header of each column of the table can be clicked to toggle the sorting. By default, the table is sorted by startTime. Each column in the table represents the same information as in Chrome devtool for the same name. The request information in each row of the table can be expanded by clicking on it, and when expanded you can see Request headers/Response headers for the request.
Flame chart
The detailed runtime of the browser during Lab runs is visualized as a flame graph. For more information about flame graphs, please refer to How to use flame chart.
The flame chart contains three parts of information:
- Network: Network request
- Tasks: Information about the execution of the browser's own tasks, such as calculating styles, rendering, etc.
- Main: JavaScript main thread execution information.
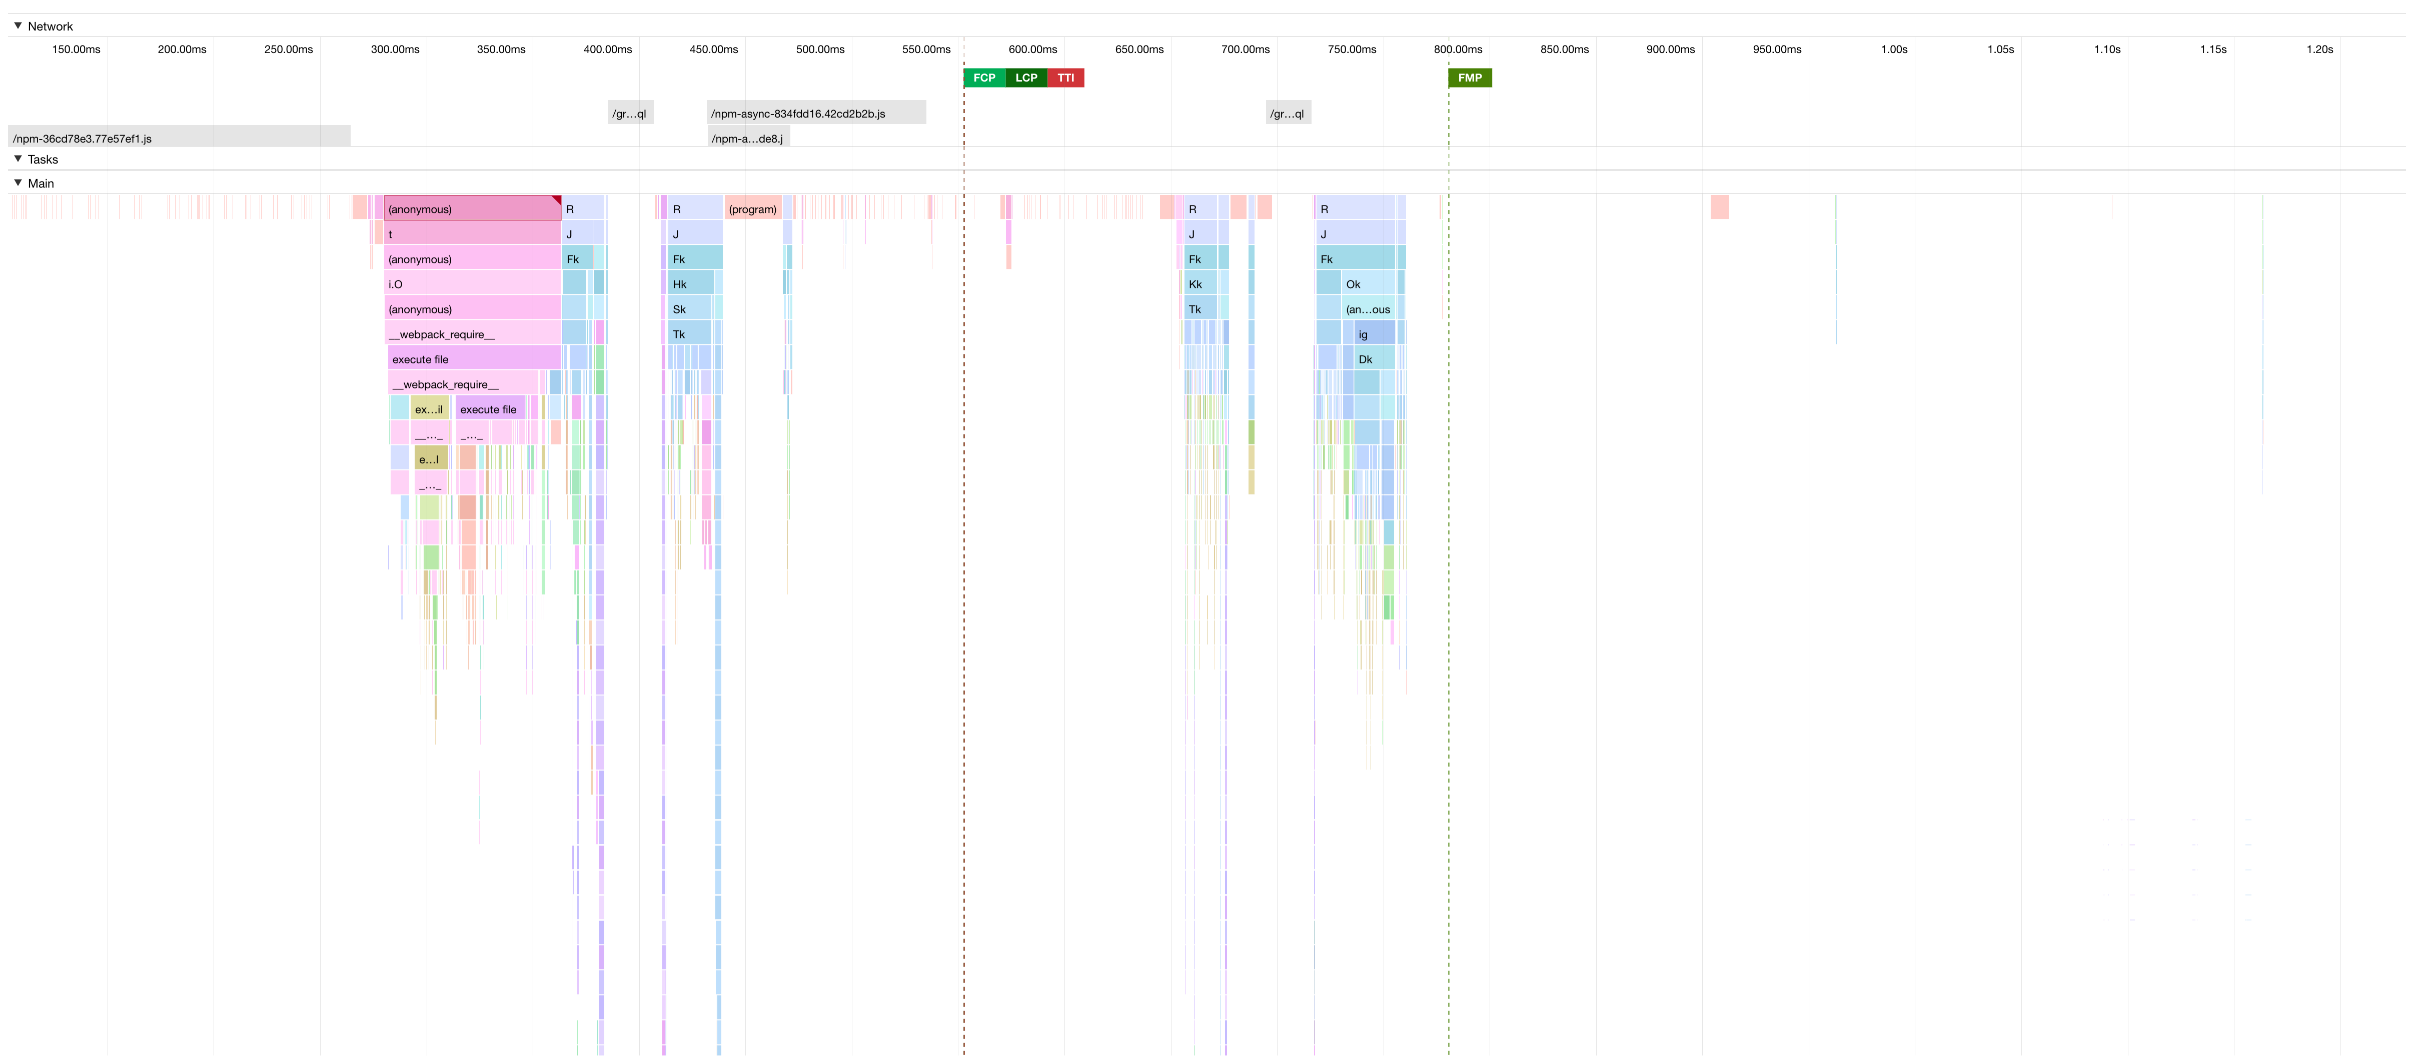
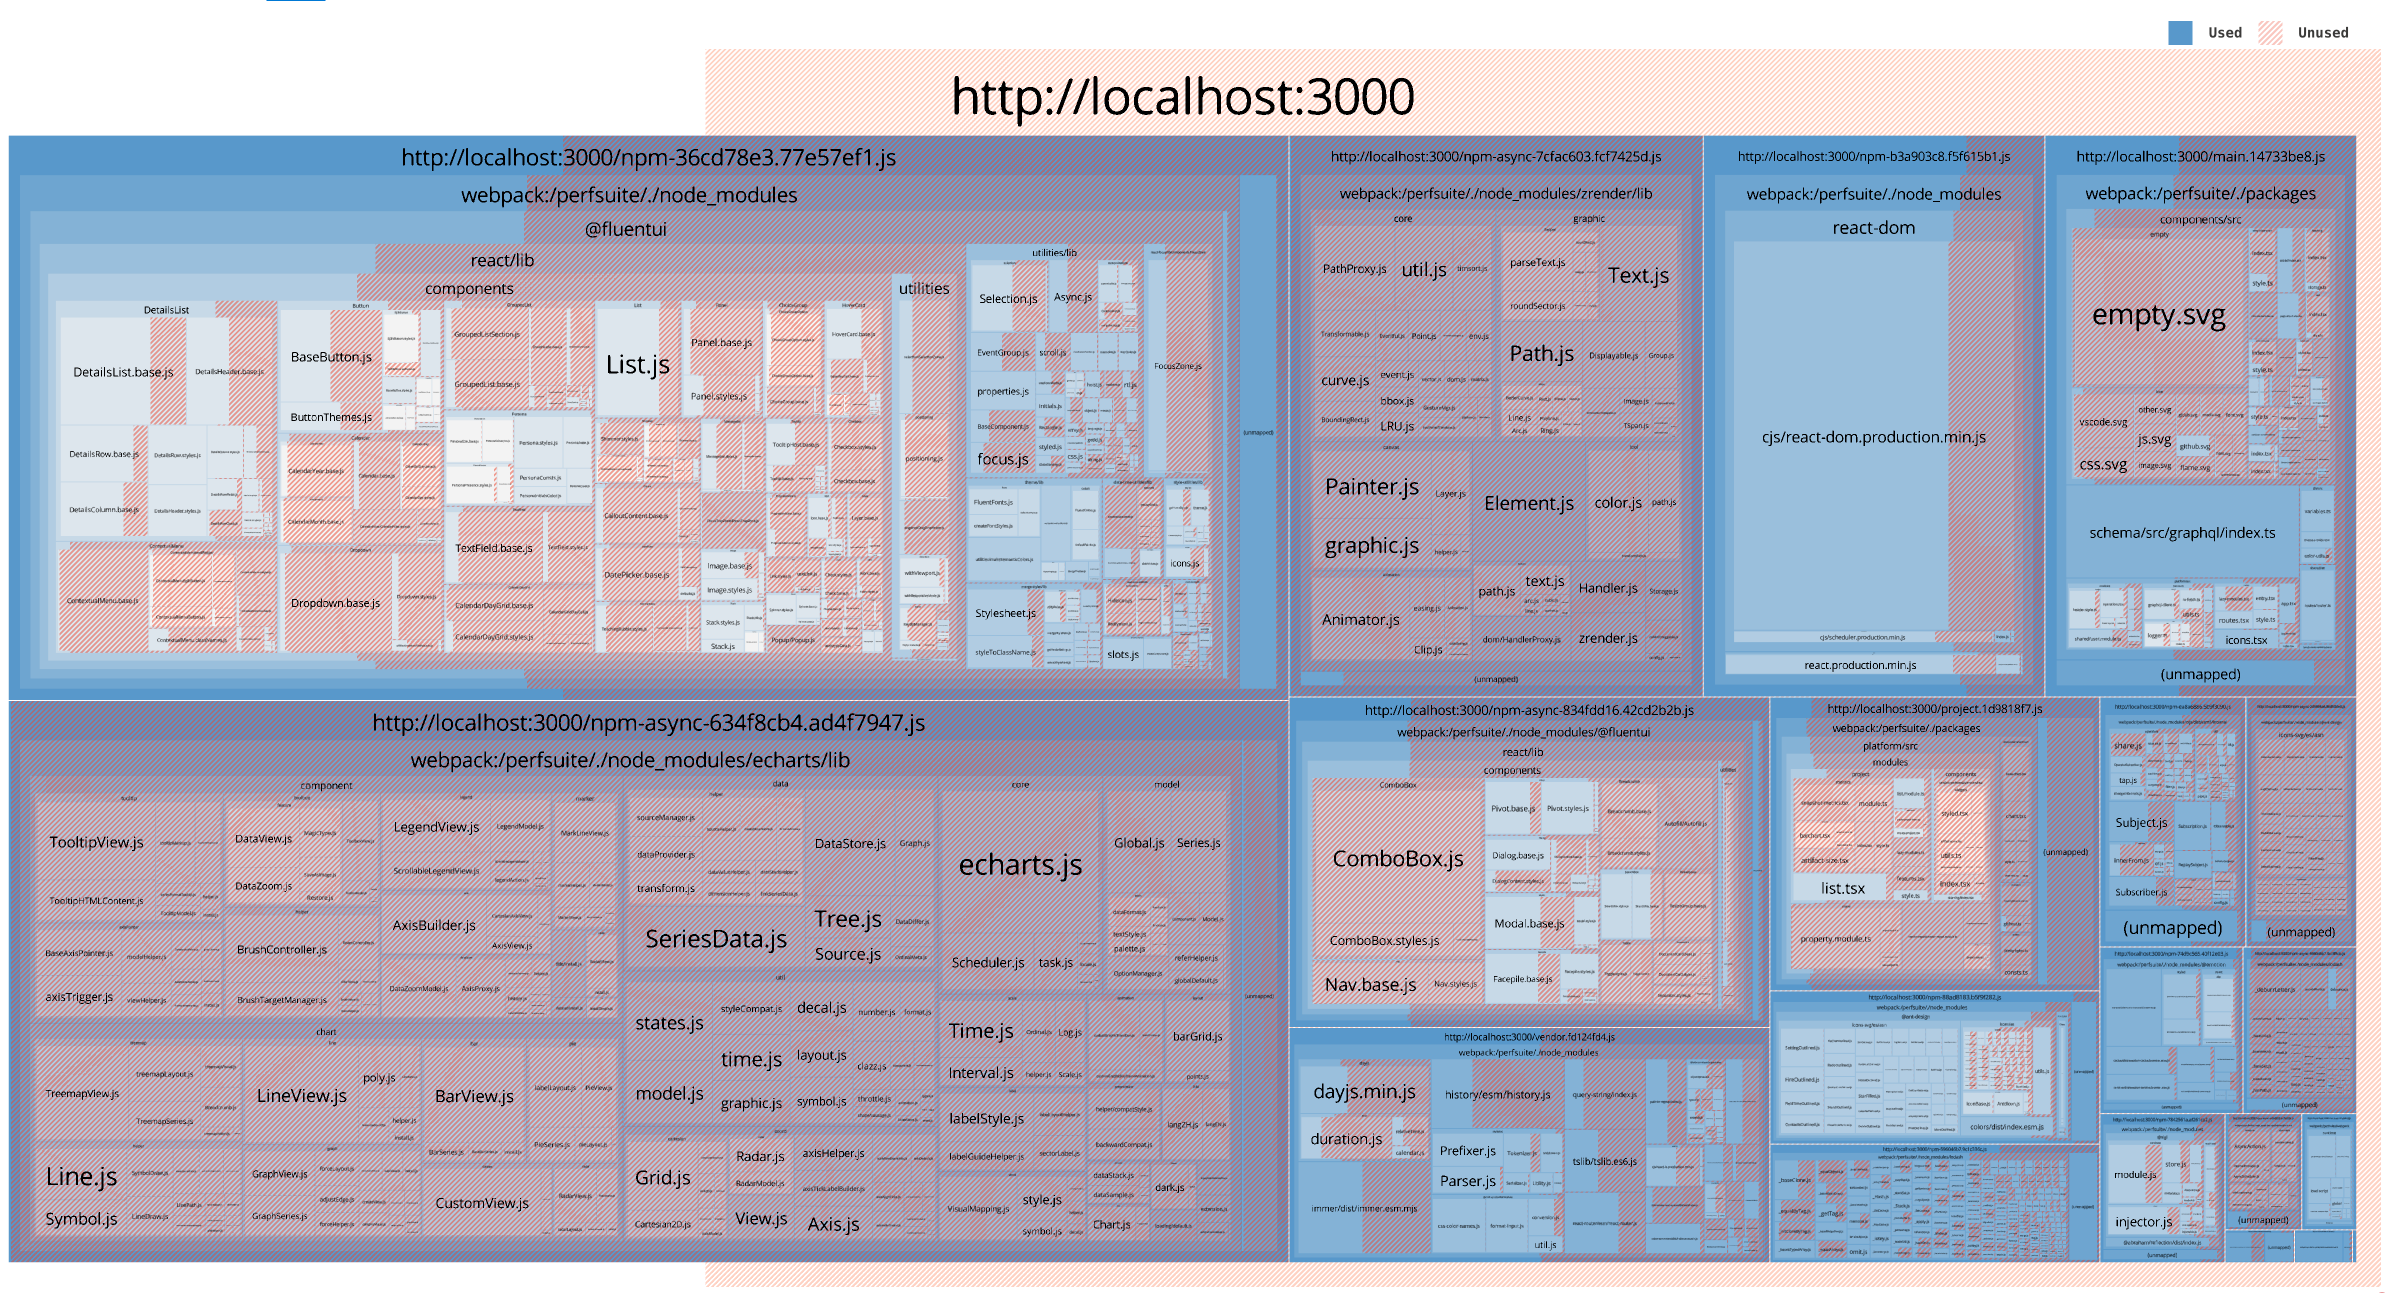
Treemap
The visualization shows the JavaScript coverage on the page during runtime. The red shaded parts of the graph are the JavaScript that was downloaded but not run.
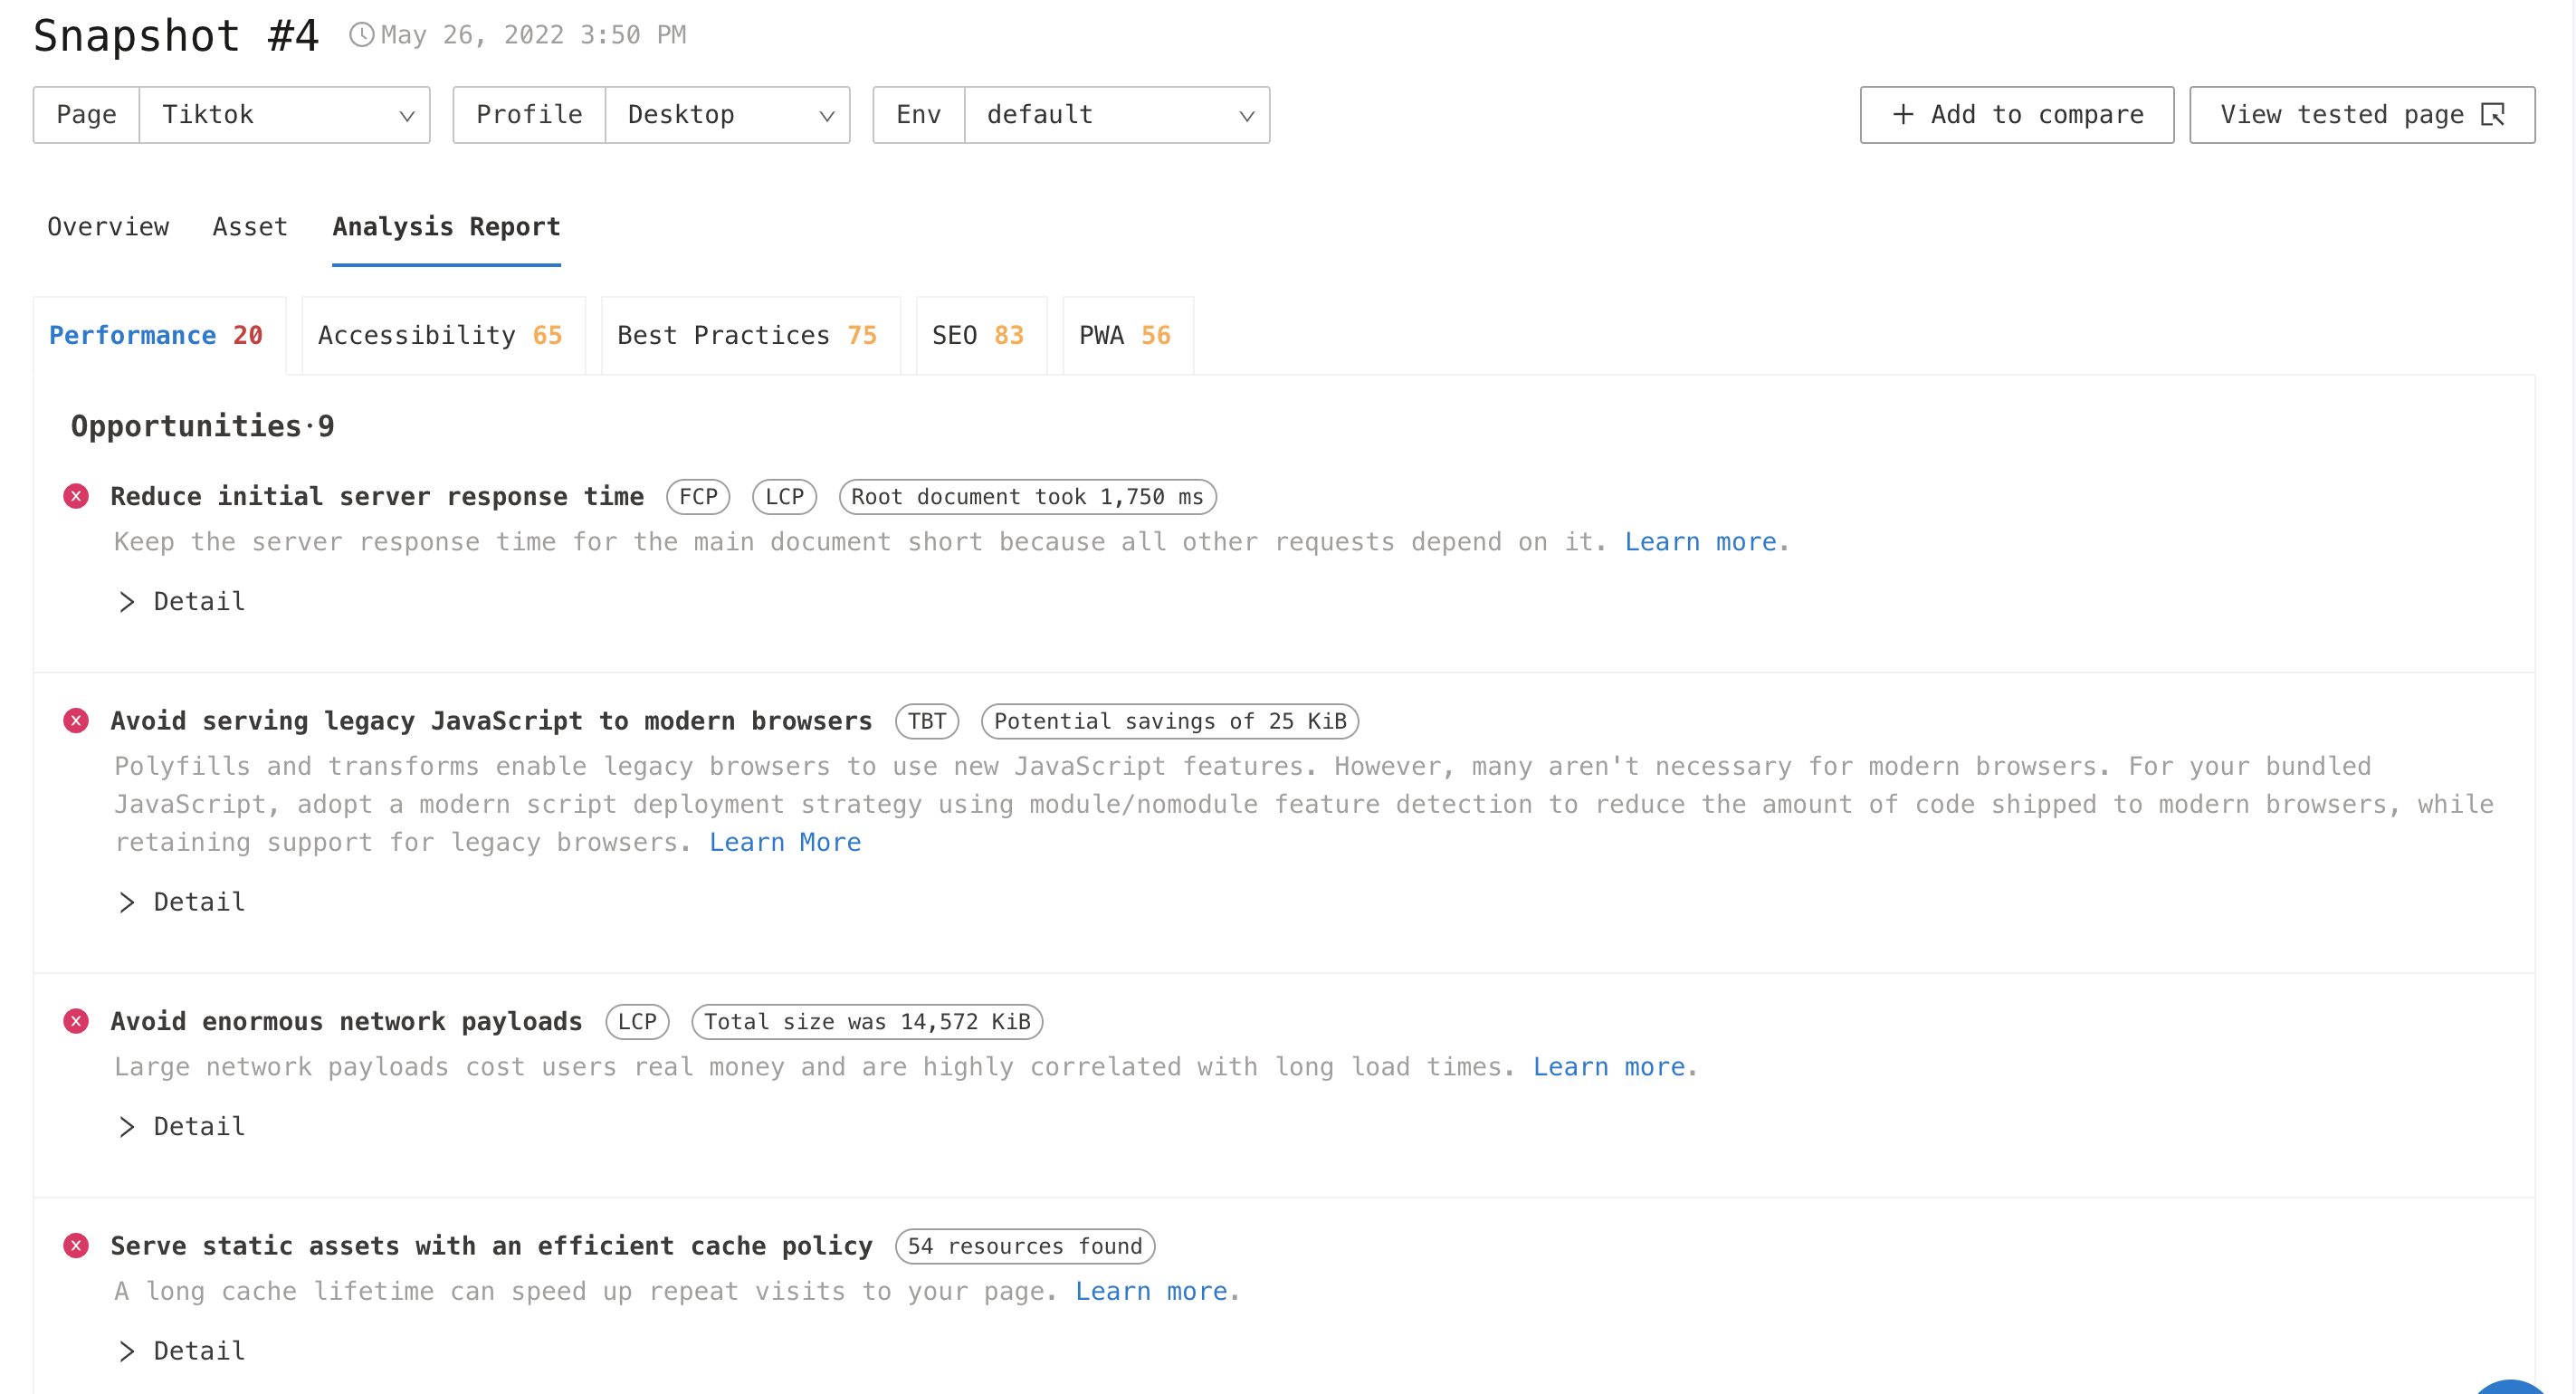
Analysis Report
Performance, SEO, Best Practices, Accessibility and PWA tabs provide information about passed and failed Lighthouse audits, highlighting opportunities for improvement.
React Flamegraph
The React Flamegraph feature requires React Rrofiling to be enabled. Check: Profile Setting.
The flame chart view represents the state of your React application for a particular commit. It's very similar to the React Devltools' flame chart.
