How to read flame chart
What is flame graph?
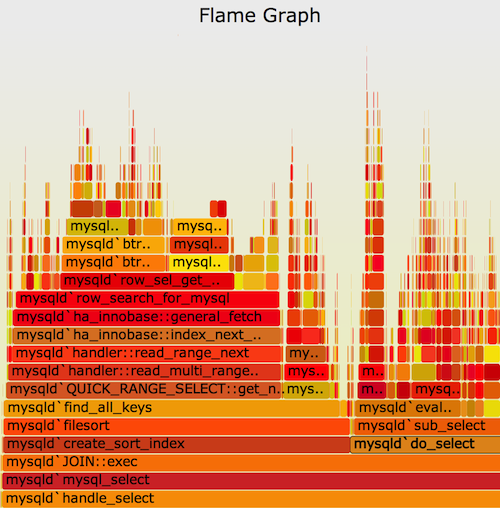
The usual flame graph is a visualization of the program call stack information during program runtime, with the horizontal coordinate being the function calls and the vertical coordinate the call stack depth. It is named Flame Graph because the visualized image looks like a flame.

In the flame graph, the function calls from bottom to top. Taking the above diagram as an example, the function call is
// a => b : function a called function b
root
  => mysqld`handle_select
    => mysqld`mysql_select
      => mysqld`JOIN::exec
        => mysqld`create_sort_index
          => ...
As a front-end developer, you must have used the flame chart in the performance tab of Chrome Devtools.
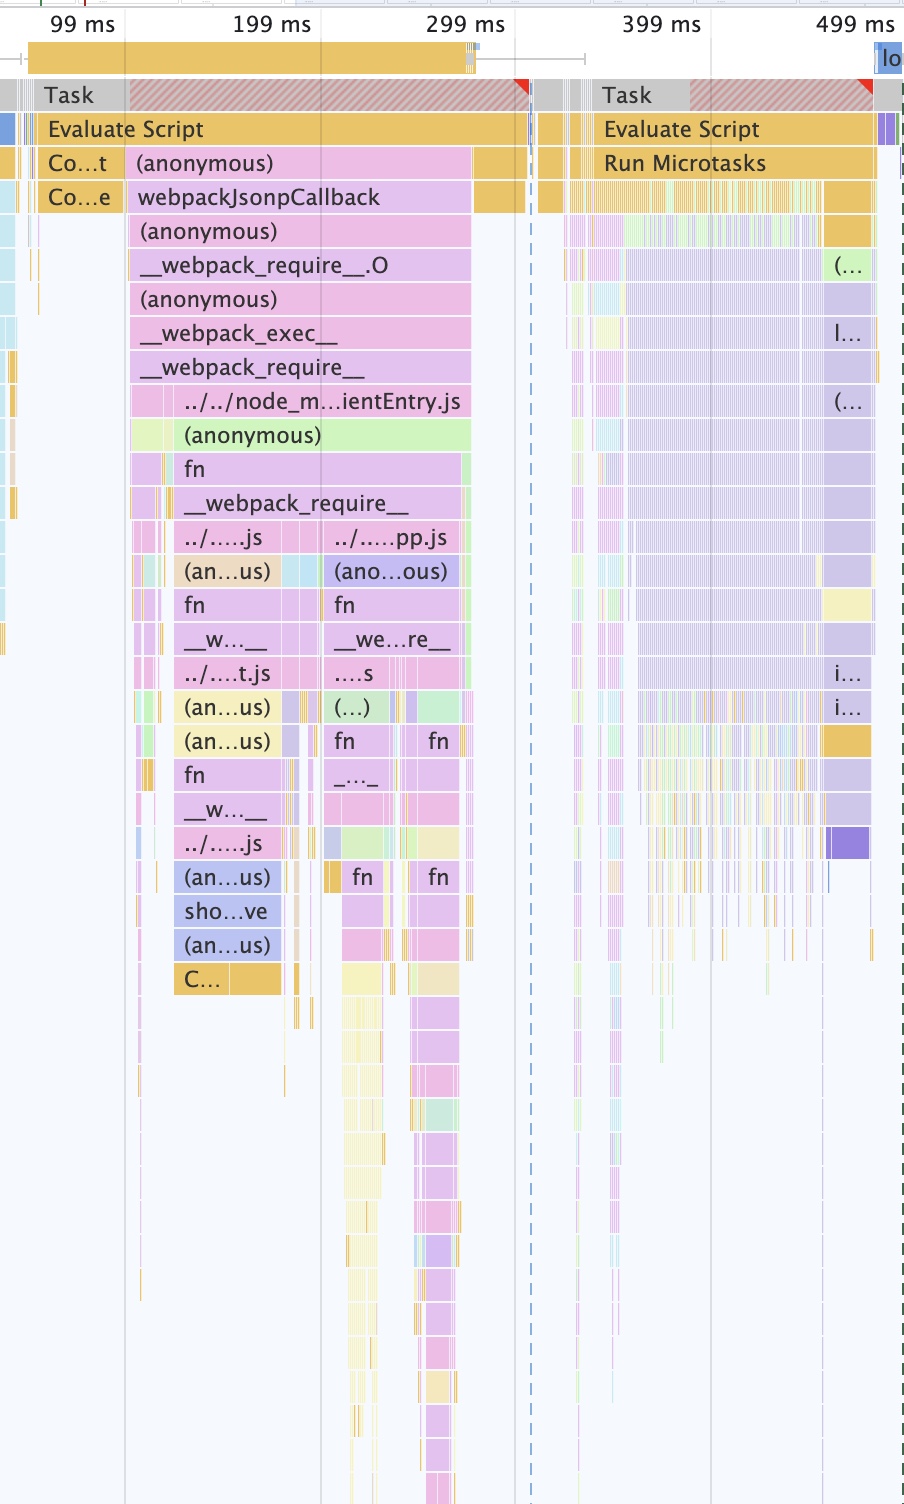
However, the Flame Chart given by Chrome Devtool usually appears in a different form: the horizontal coordinate is the time (as opposed to the above definition), the vertical coordinate is the call stack depth, and the visualization is an inverted flame or waterfall. Because the meaning of the horizontal coordinate has changed, the Chrome team also calls it a Flame Chart instead of a Flame Graph.

Obviously in front-end, the latter (Flame Chart) can show more relevant information about page load and execution time, and can be combined with key performance indicators such as FP, FCP, TTI, etc. to give developers intuitive optimization guidance. So what we are going to talk about is Flame Chart.
How the flame chart is generated
Takes a snapshot of the program's current stack at regular intervals (100 μs ~ 1000 μs, 1000 μs = 1 ms). Since the snapshot interval is very short, the sum of the time of the same stack in multiple consecutive snapshots can be considered as the execution time of the function at the top of the stack.
How to read the flame chart?
- Understand the stack and call relationships
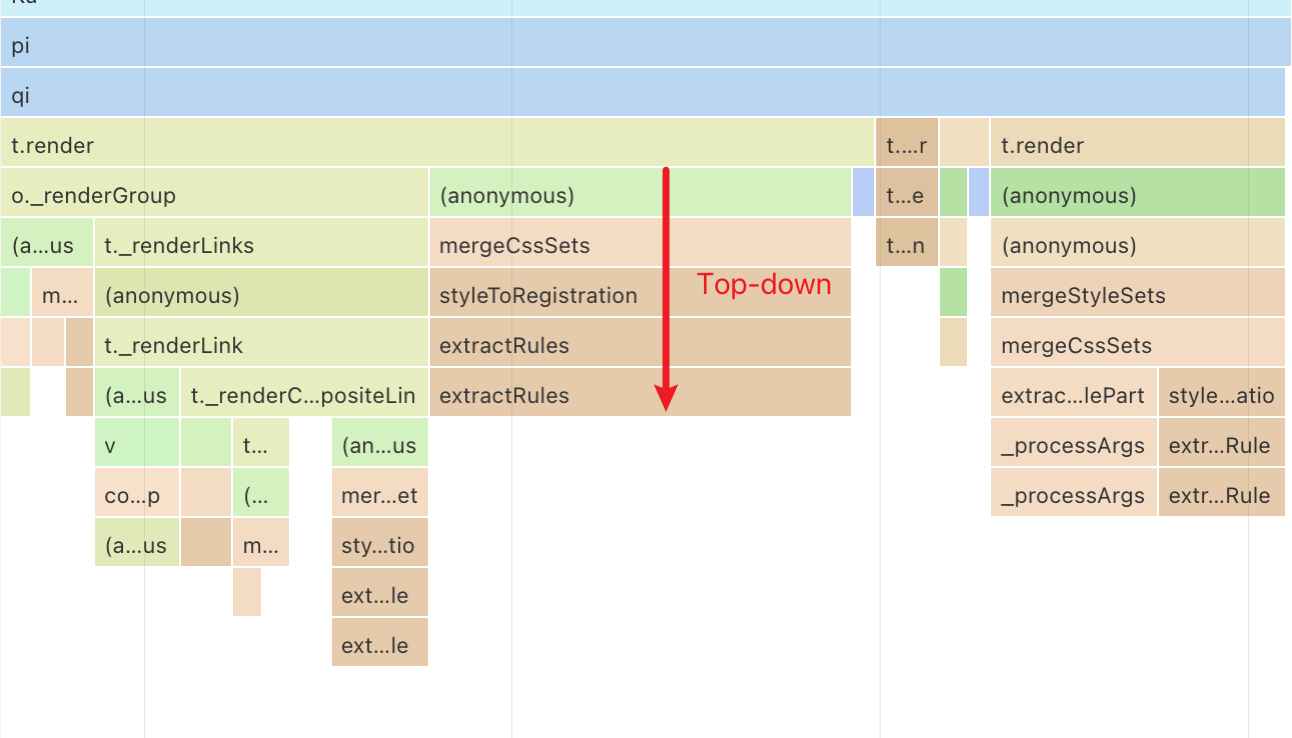
The call stack of functions in the flame chart is the opposite of the upper/lower level relationship in the flame graph, i.e., upper level functions call lower level functions.
In the diagram below, the functions are called as i calls Ce, Ce calls S.forEach, and so on.

- Function execution time
Function execution time is the hardest part for people new to flame chart, but it is the most critical part.
Function execution time is divided into Total Time and Self Time.
The Total Time is easily understood as the total time spent by a function from the first line of the function body to the end of the last line. The self-execution time is the time taken to call the other functions in the Total Time.
So we have Total Time = Self Time + Children TotalTime.
Back in the flame diagram, the time span of each node in the diagram in the horizontal coordinate is the total time of that function call.

As you can see above, the highlighted function checkDeferredModules spans 1.32 seconds, which is the total time of execution of that function. Moving down the call stack, we see that the function immediately calls another function __webpack_require__, and the __webpack_require__ total time is also 1.32 seconds. Based on the time formula above, we can understand that the checkDeferredModules function's self-execution time is negligibly short, so we can ignore this function in our reading and not think about optimizing its performance, and instead focus on the functions it calls.
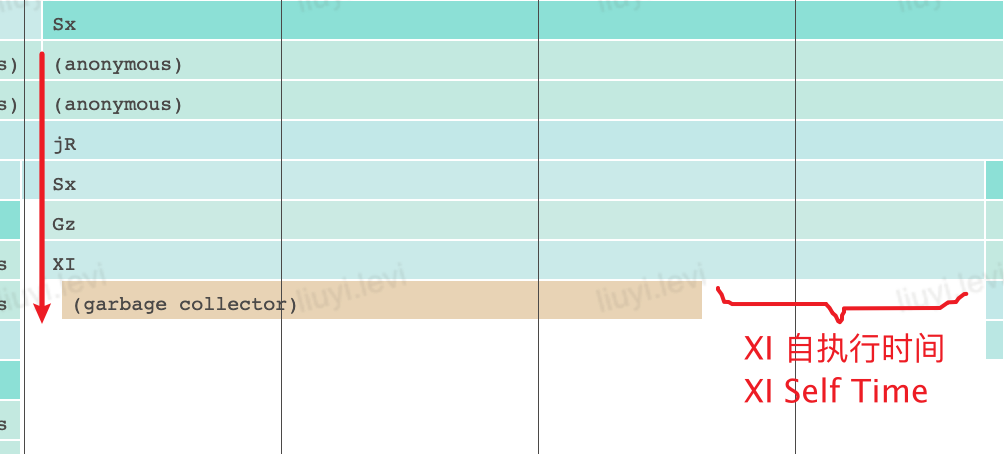
Similarly, in the figure below, function XI is the top-level (last called) function, but during its execution the engine triggers a GC, and the remainder of the GC time is the self-execution time of function XI.

In summary, the first functions we need to focus on in the process of reading the flame chart are those that occupy a longer span of time in the flame chart, and then follow the function call stack path to find out the function calls in the call path self-execution time that are longer, and make targeted optimizations.