VSCode Extensions
Install
Search extension perfsee in VSCode Marketplace and install.
Using
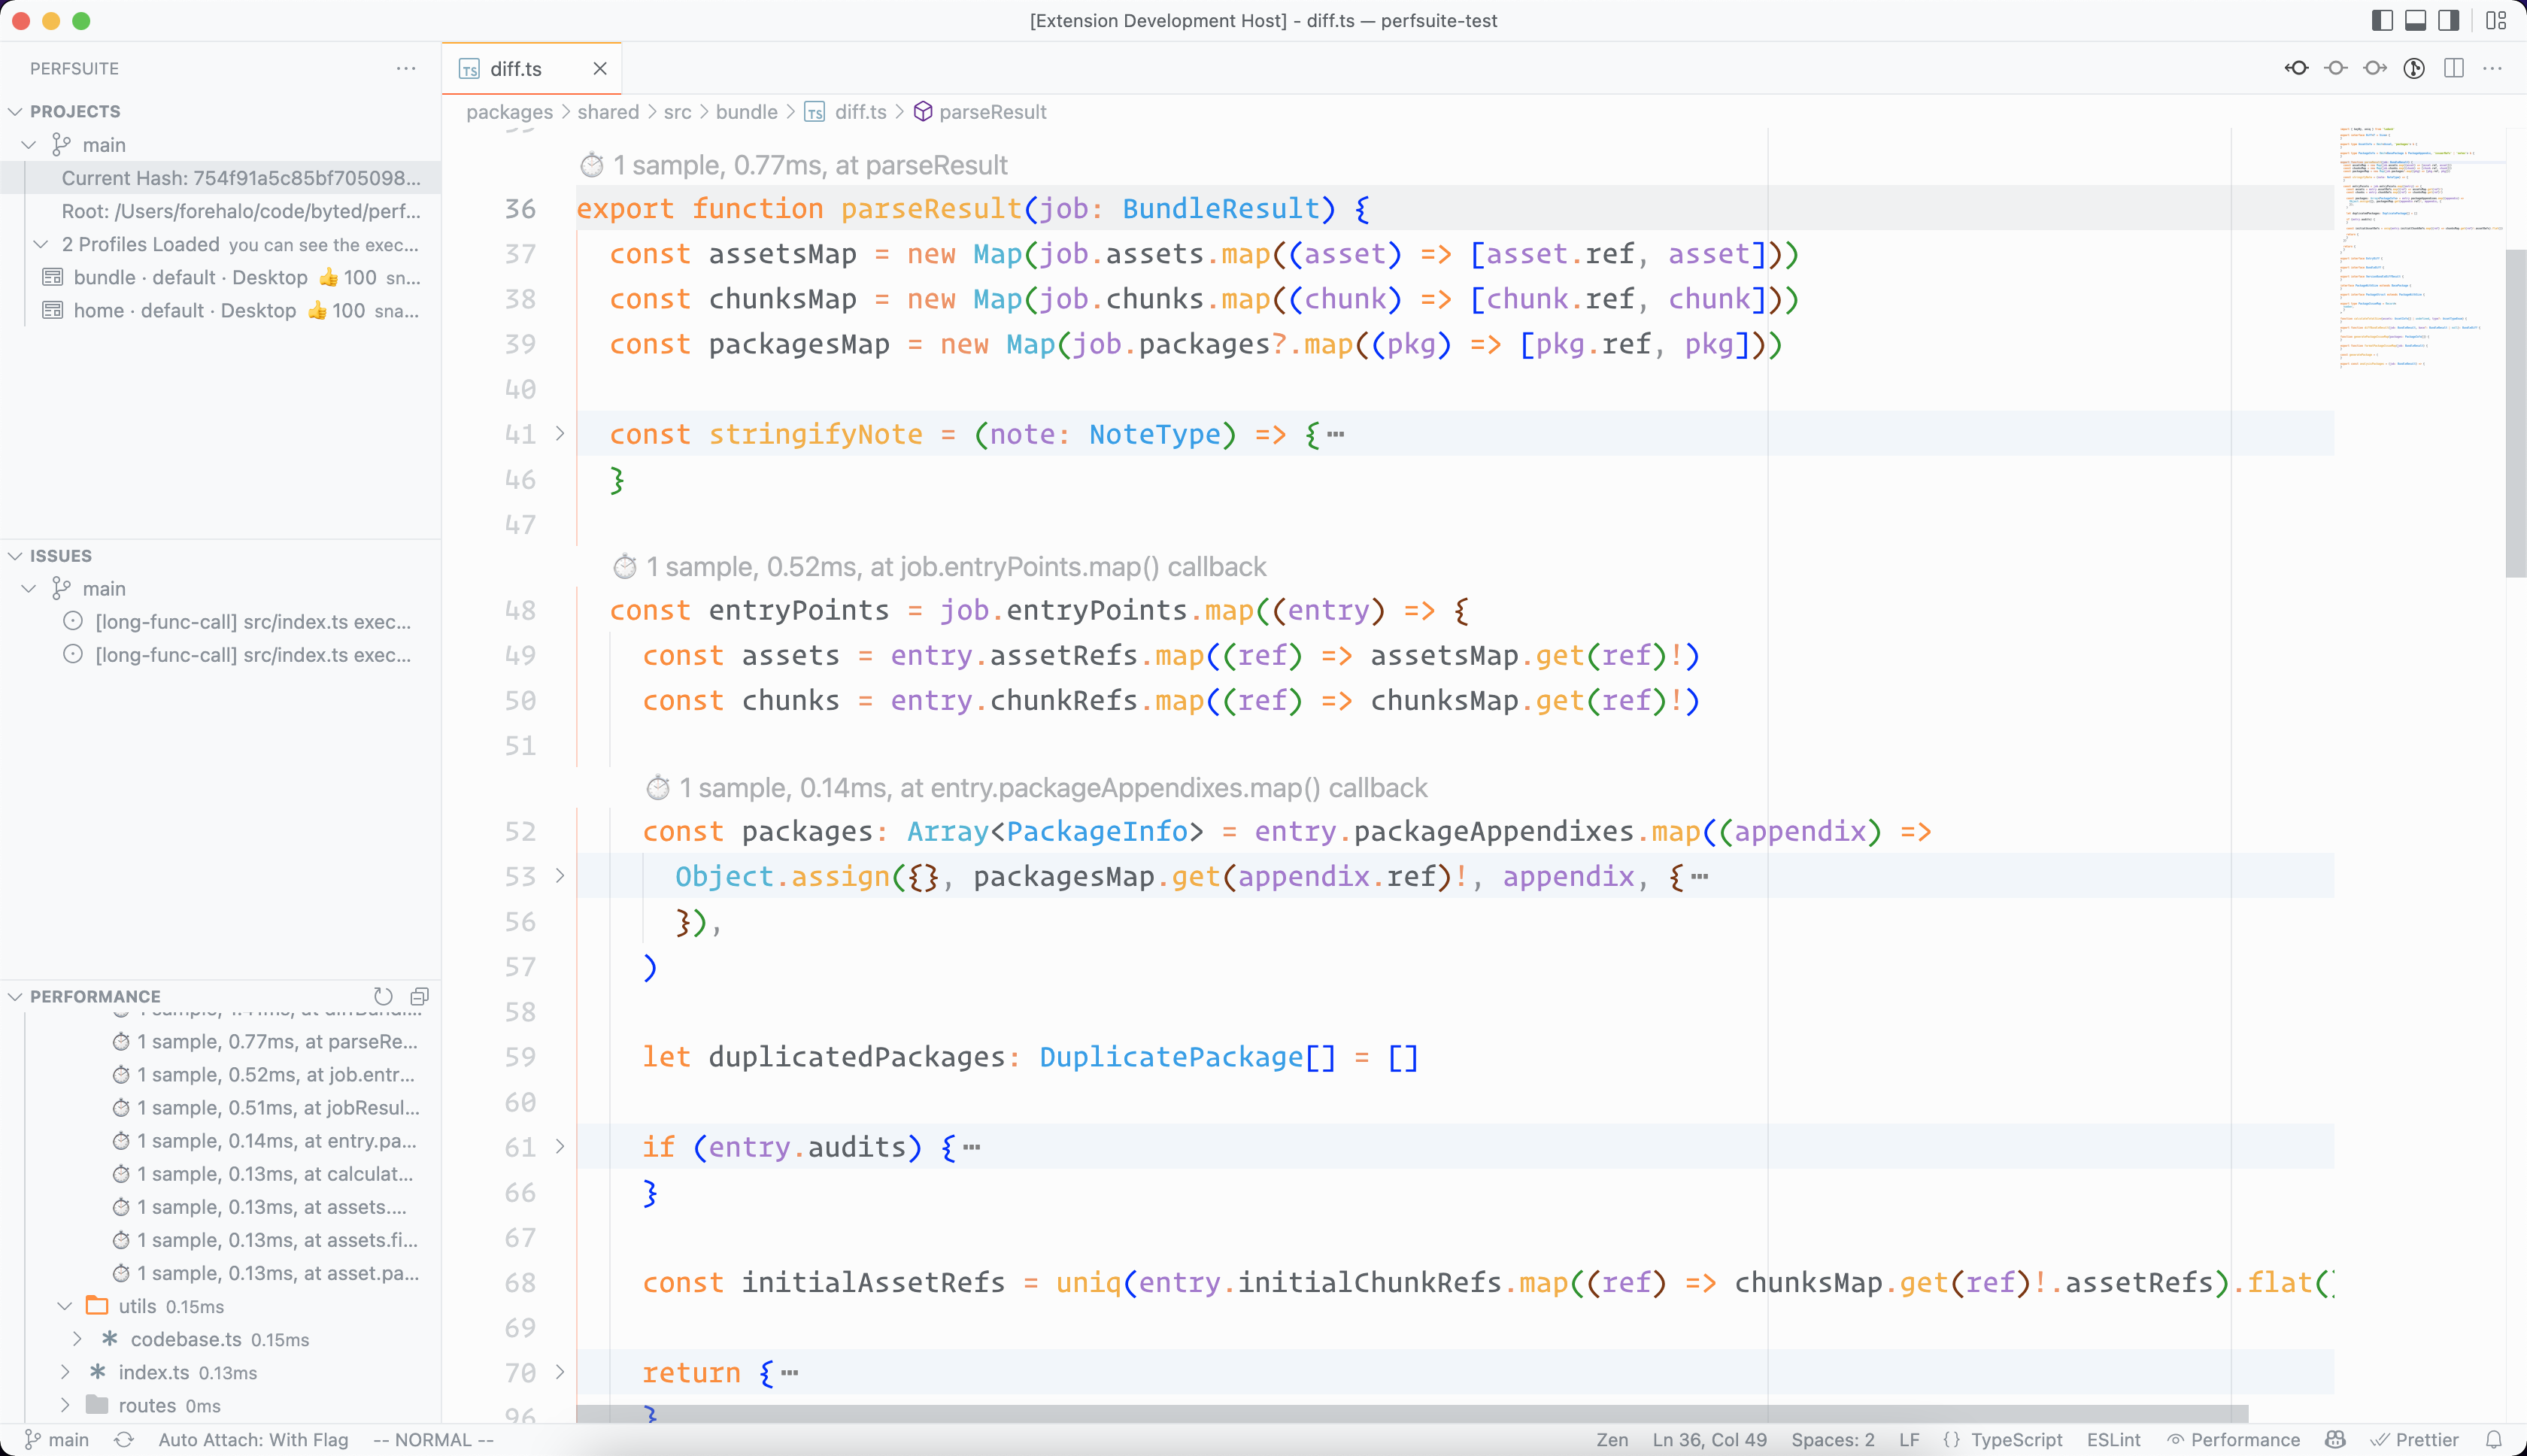
After installation, the Perfsee icon will appear in the sidebar of VSCode, and you can see Projects, Issues, and Performance treeviews by clicking the icon.
![]()
Projects: Shows the projects currently open in VSCode. The plugin will automatically analyze the project ID, directory, branch, and version information based on local Git information. You can also set this manually.
Issues: The performance issues analyzed found in the current project.
Performance: Shows the total runtime for each file and folder in the directory, with slower files and folders shown in red.
Codelens
In the VSCode editor, the extension will automatically scan the performance data in the current file and show as codelens.

File navigating
Click on the file to expand the execution time of the included functions, and click on the execution time information to jump to the corresponding location in the source code.
Open inline flame graph
Each executed function in the editor displays execution time, and clicking on the execution time will show the Lab report selector. Clicking to select the report you want to view and the flame graph will automatically focus on the chosen function.
Optimization tips using flame chart: How to read flame chart
Jump between flame graph and files
You can jump to each other in the flame chart and the editor interface. Click to select a function call in the flame chart, and click the blue file icon on the right side of the call stack at the bottom of the flame chart to jump to the corresponding source code location.