Source Report
Source Issues List
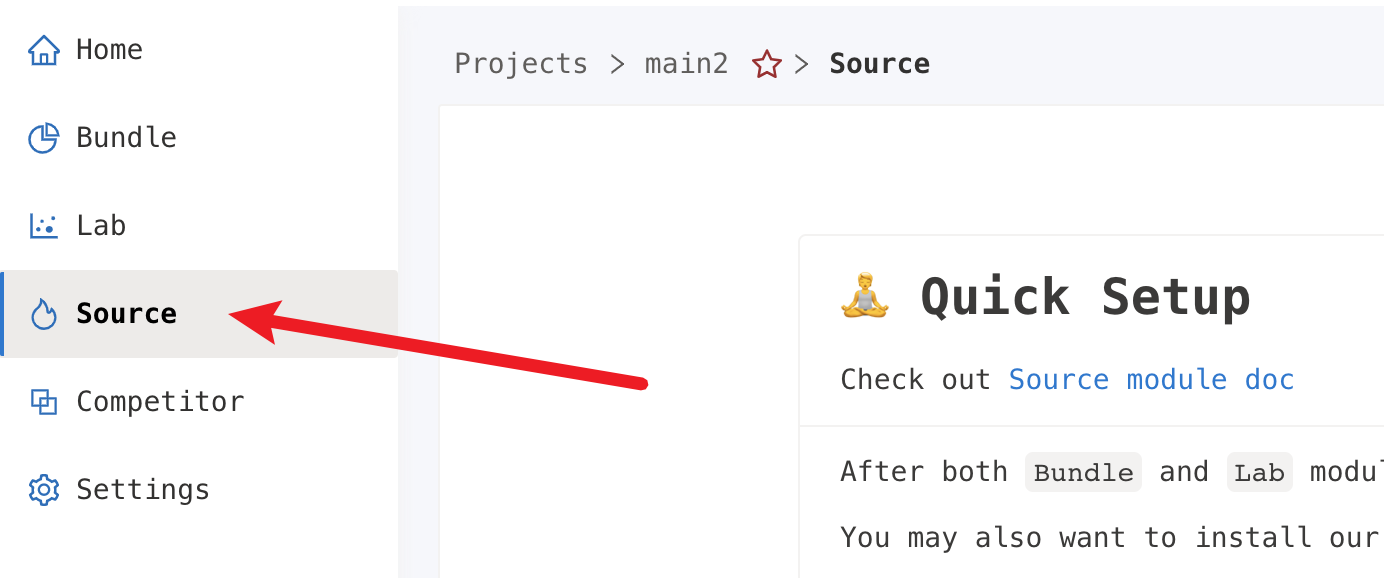
After entering the project, you can click on the Source tab in the sidebar to go to the source analysis page.

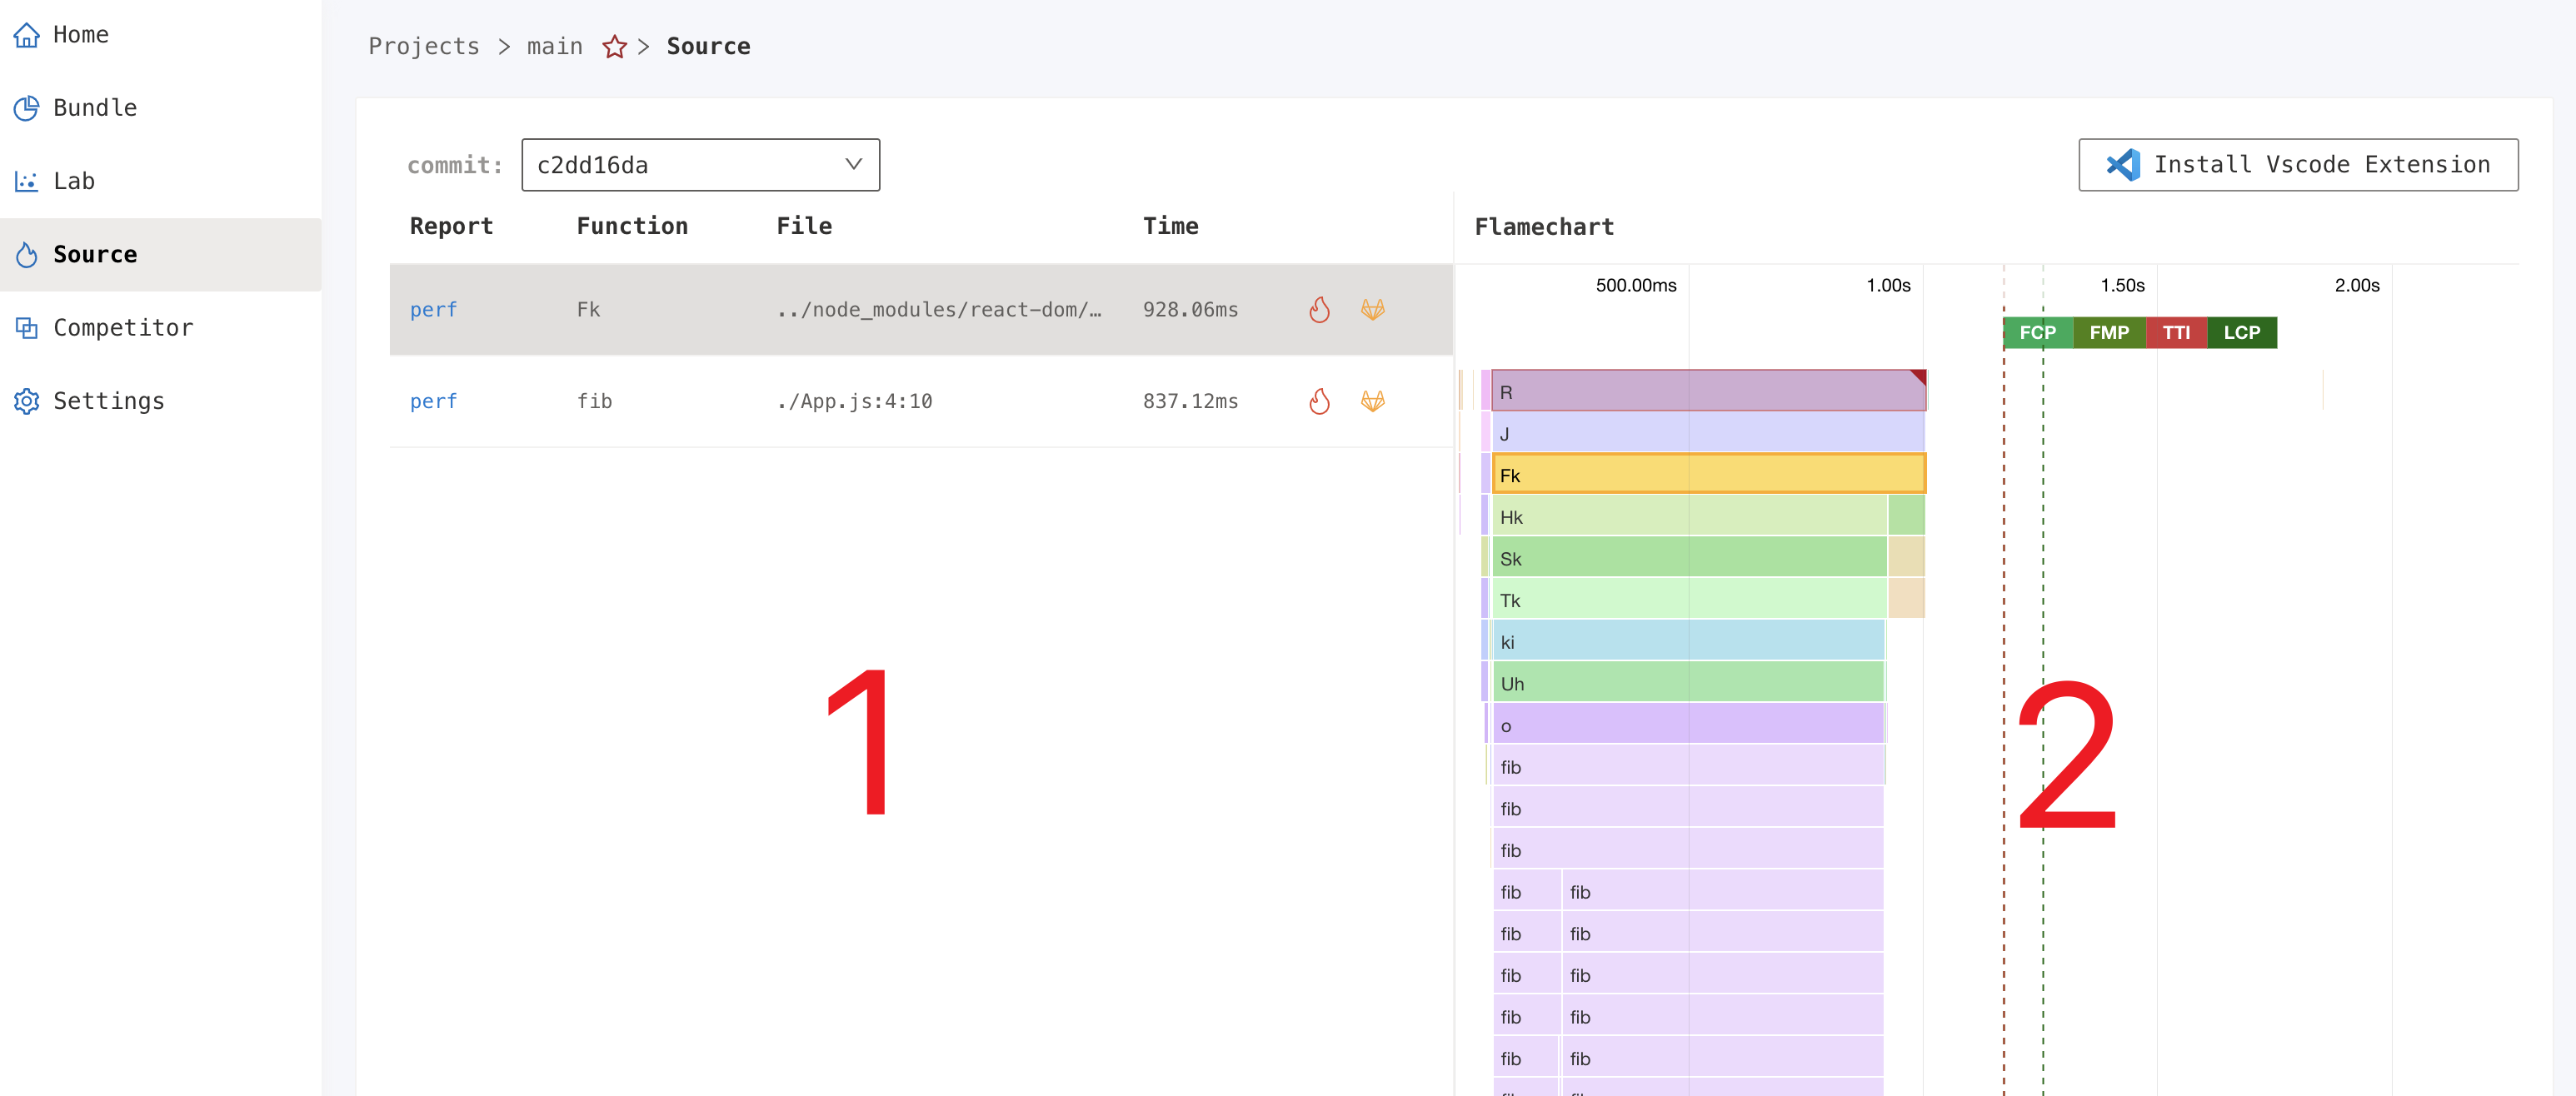
The page is split into two parts, the left side shows the execution time audit result of the selected commit, and the right side shows the flame chart. By default the latest commit will be selected.

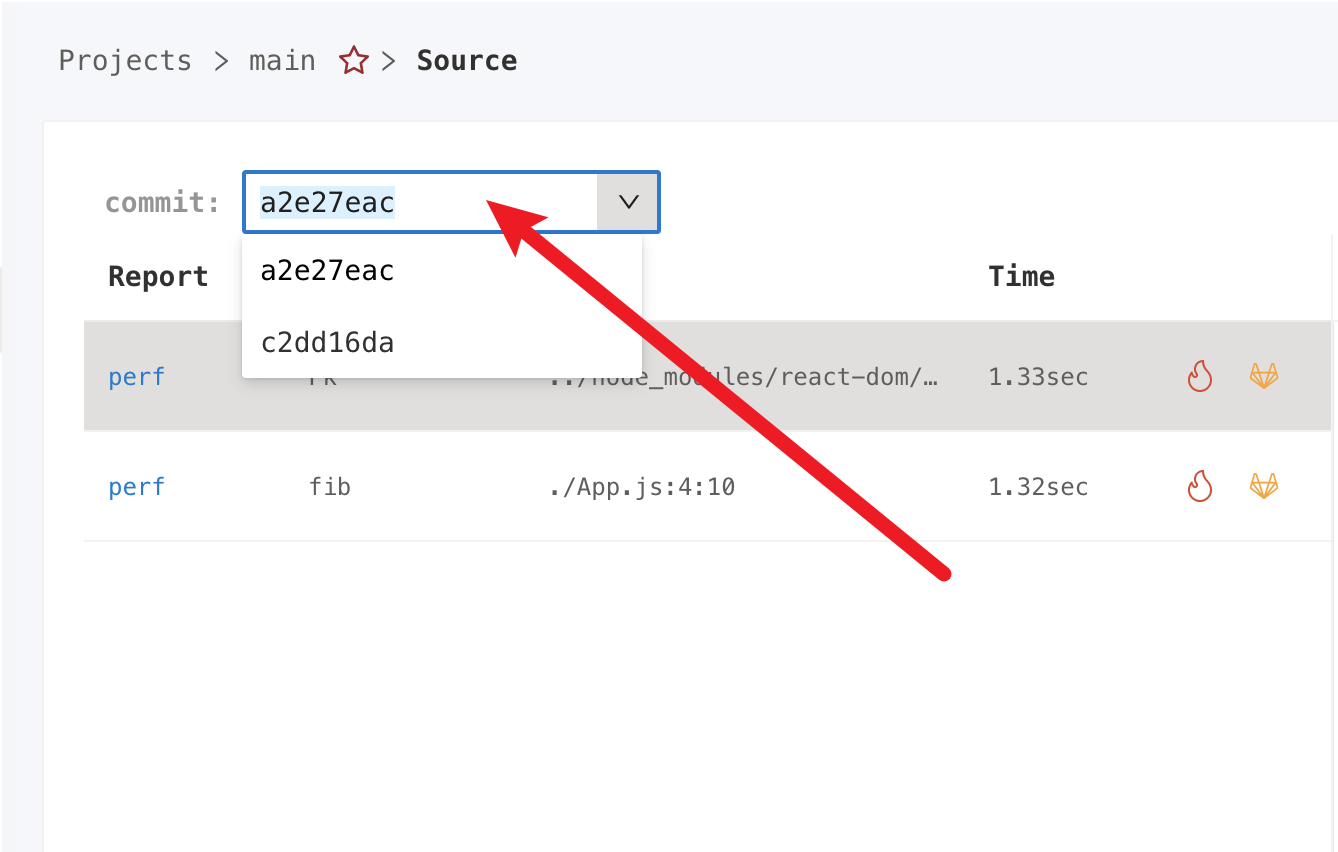
You can click on the commit selector on the left to select the commit of interest.

The list on the left shows the issues that were analyzed for the selected commit, the issues details are displayed by column as follows.
- Report Lab report that found the issue
- Function Function name of the issue. The function displayed
(anonymous)means that it is an anonymous function,() => {}orfunction() {}. - File File name of the issue (formatted as
filename:row:column) - Time Function execution time
- Actions Buttons for "Show in flame chart" and "Open Commit on Github/GitLab"
The function and file name can be used to locate the exact location of the issue in the source code.

If the file name is too long, it will be truncated automatically. when hovering to the file name, the truncated file name will be displayed on tooltip, and can be copied to jump directly to the function definition via the editor (e.g. VSCode cmd+p).
Flame chart
During the Lab running, we will record the browser Profile data to draw the flame chart. In order to improve the readability of the flame chart and make it easier for developers to understand the call chain, we reduce all the call stack information in the flame chart to the real source paths and function names, which is why we need Webpack to generate the correct SourceMap output during the packaging process.
Optimization tips on flame chart: How to read flame chart
How to locate the issue in the flame chart?
Click the "show in flame chart" button in the issue list to load the corresponding flame chart and directly locate the selected issue in the flame map.


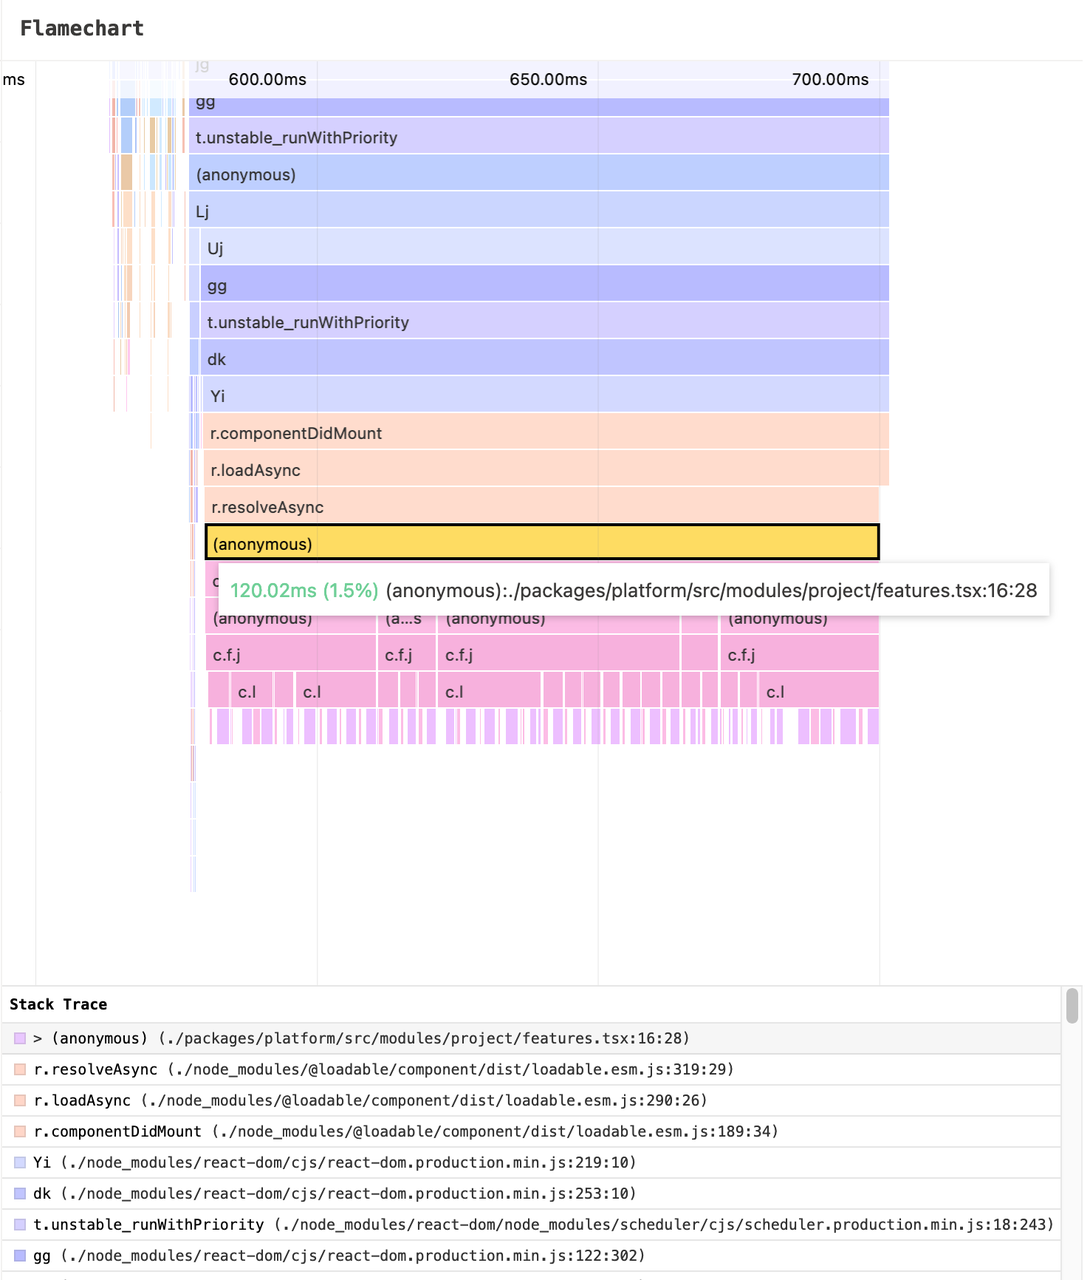
There are two main parts of flame chart, the flame chart body and the call stack. The operation is the same as the one in Chrome Devtool, you can use the mouse wheel to zoom, click and drag.
The call stack displays a list of the functions above the currently selected function, and you can jump to the corresponding position by clicking on it.