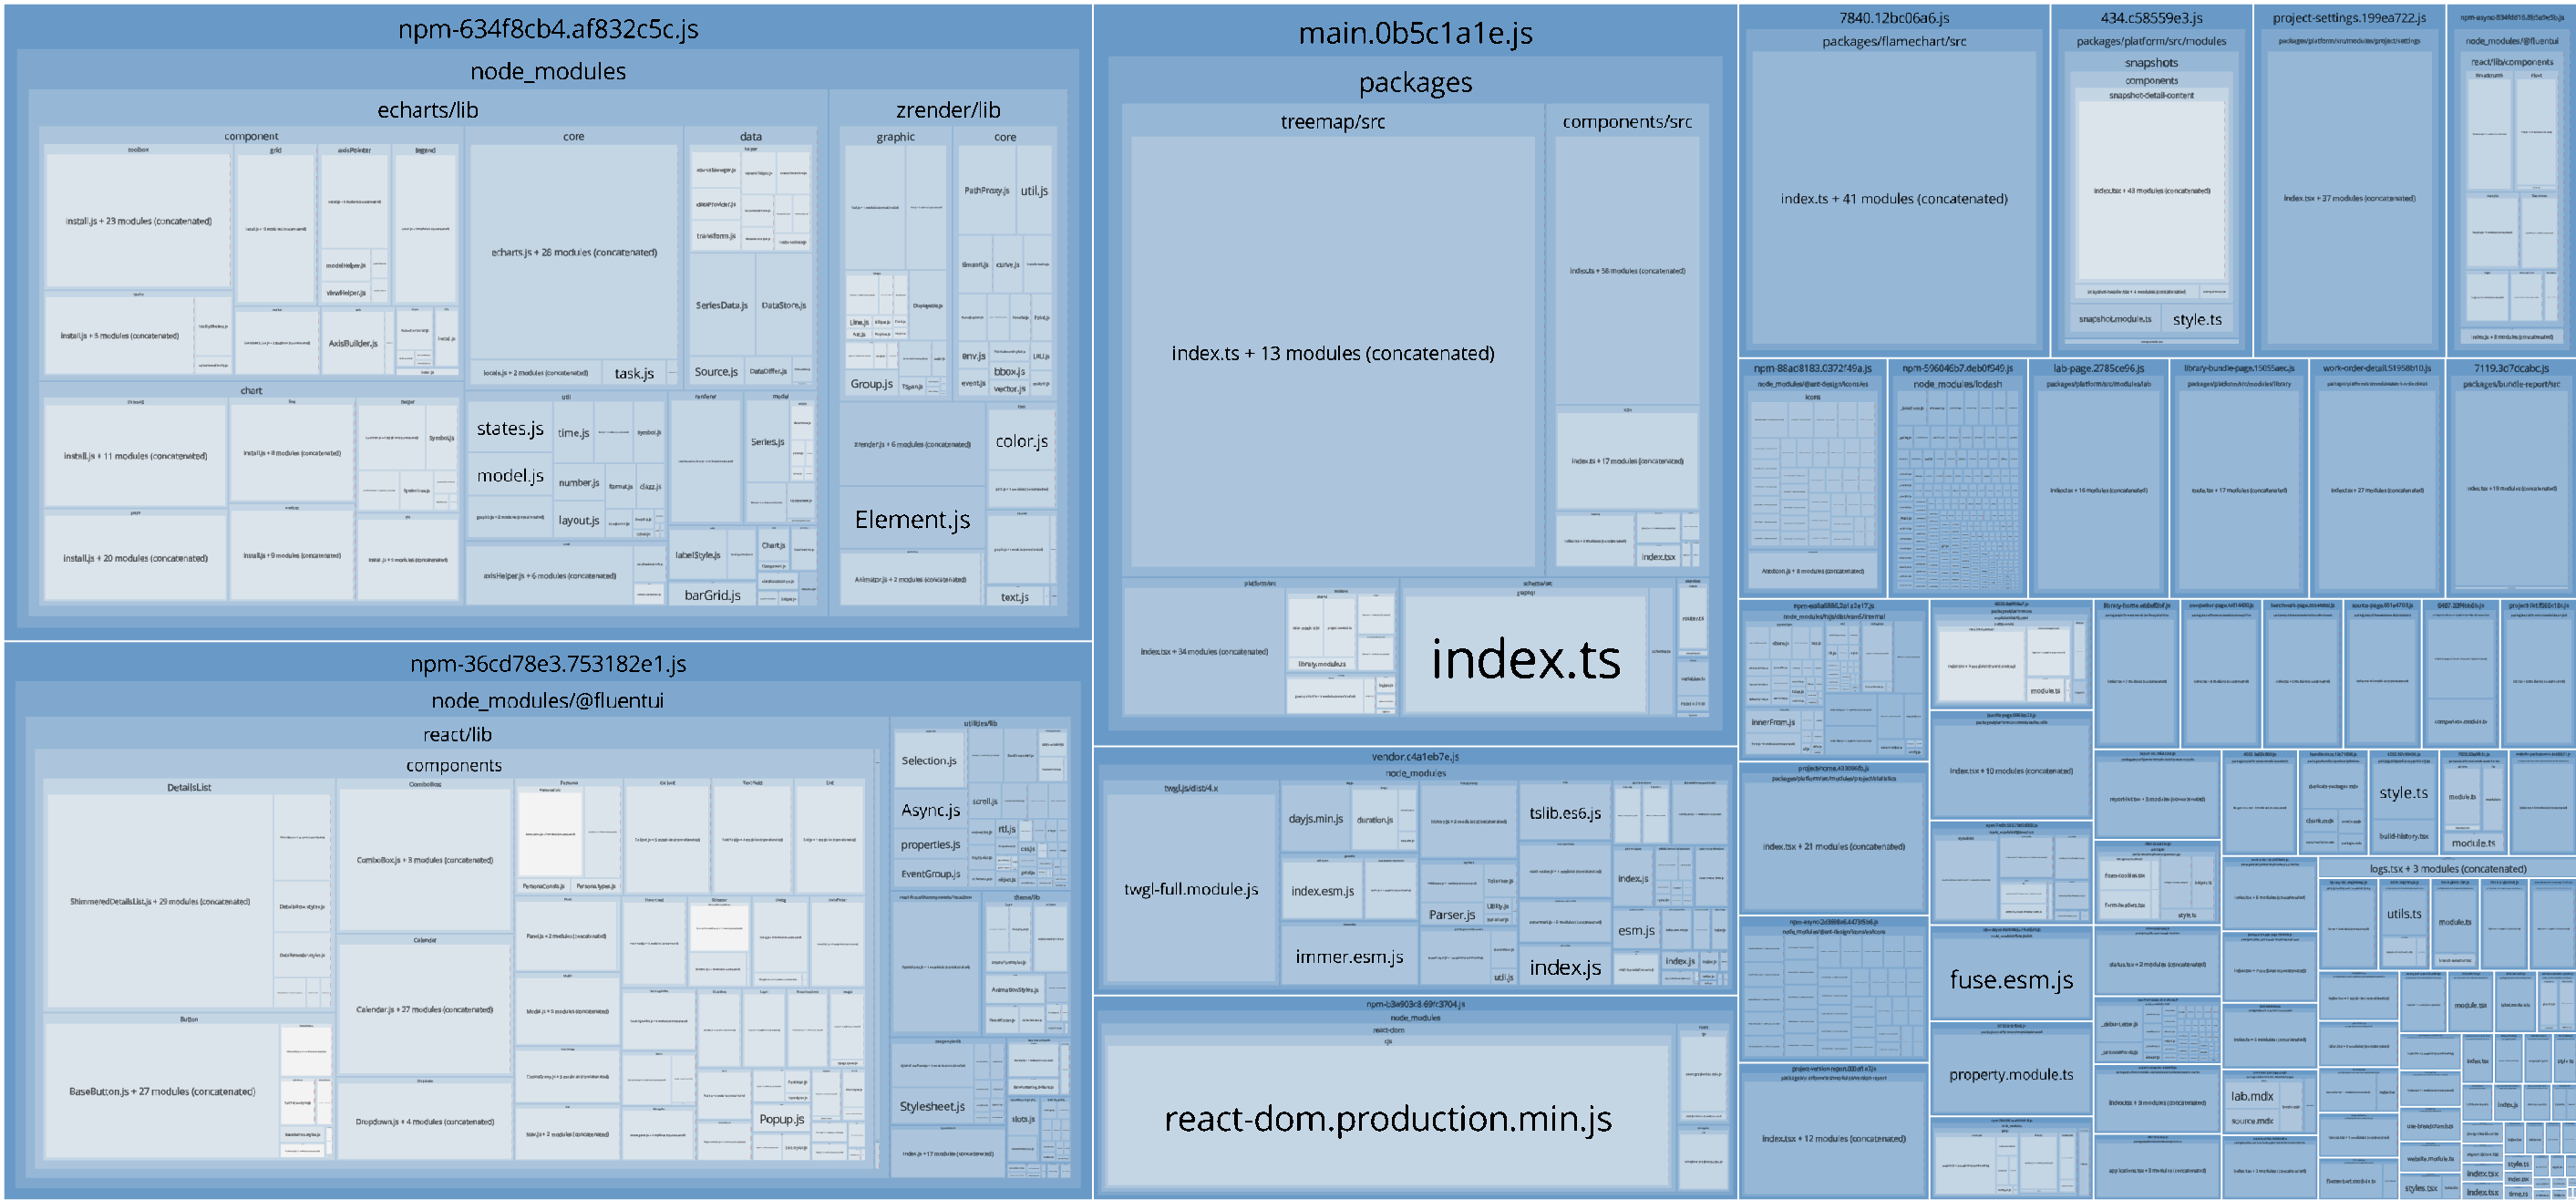
Bundle Report
In general, Bundle Report shows you the details of your builds from several aspects, from assets to third-party libraries and so on. All such information is very useful as a reference when doing optimization.
Terms
There are some terms that should be introduced before start reading the report.
Entry Points
The frontend project bundling tool usually allows for setting up multiple Entry Points. Therefore, when analyzing the output, we isolate and analyze each Entry Point to obtain the most accurate results. If the bundle contains content from multiple Entry Points, you can select the Entry Point you want to view in the dropdown box at the top of the analysis report.
Baseline
Perfsee doesn't only analyze your every single build, but also compares them with baselines and shows you what has changed in between, for example, the asset size and libraries used.
Perfsee will always choose the build from the latest release branch as the baseline, which is master by default and you can change it in Basic Settings according to your project convention.
Diff
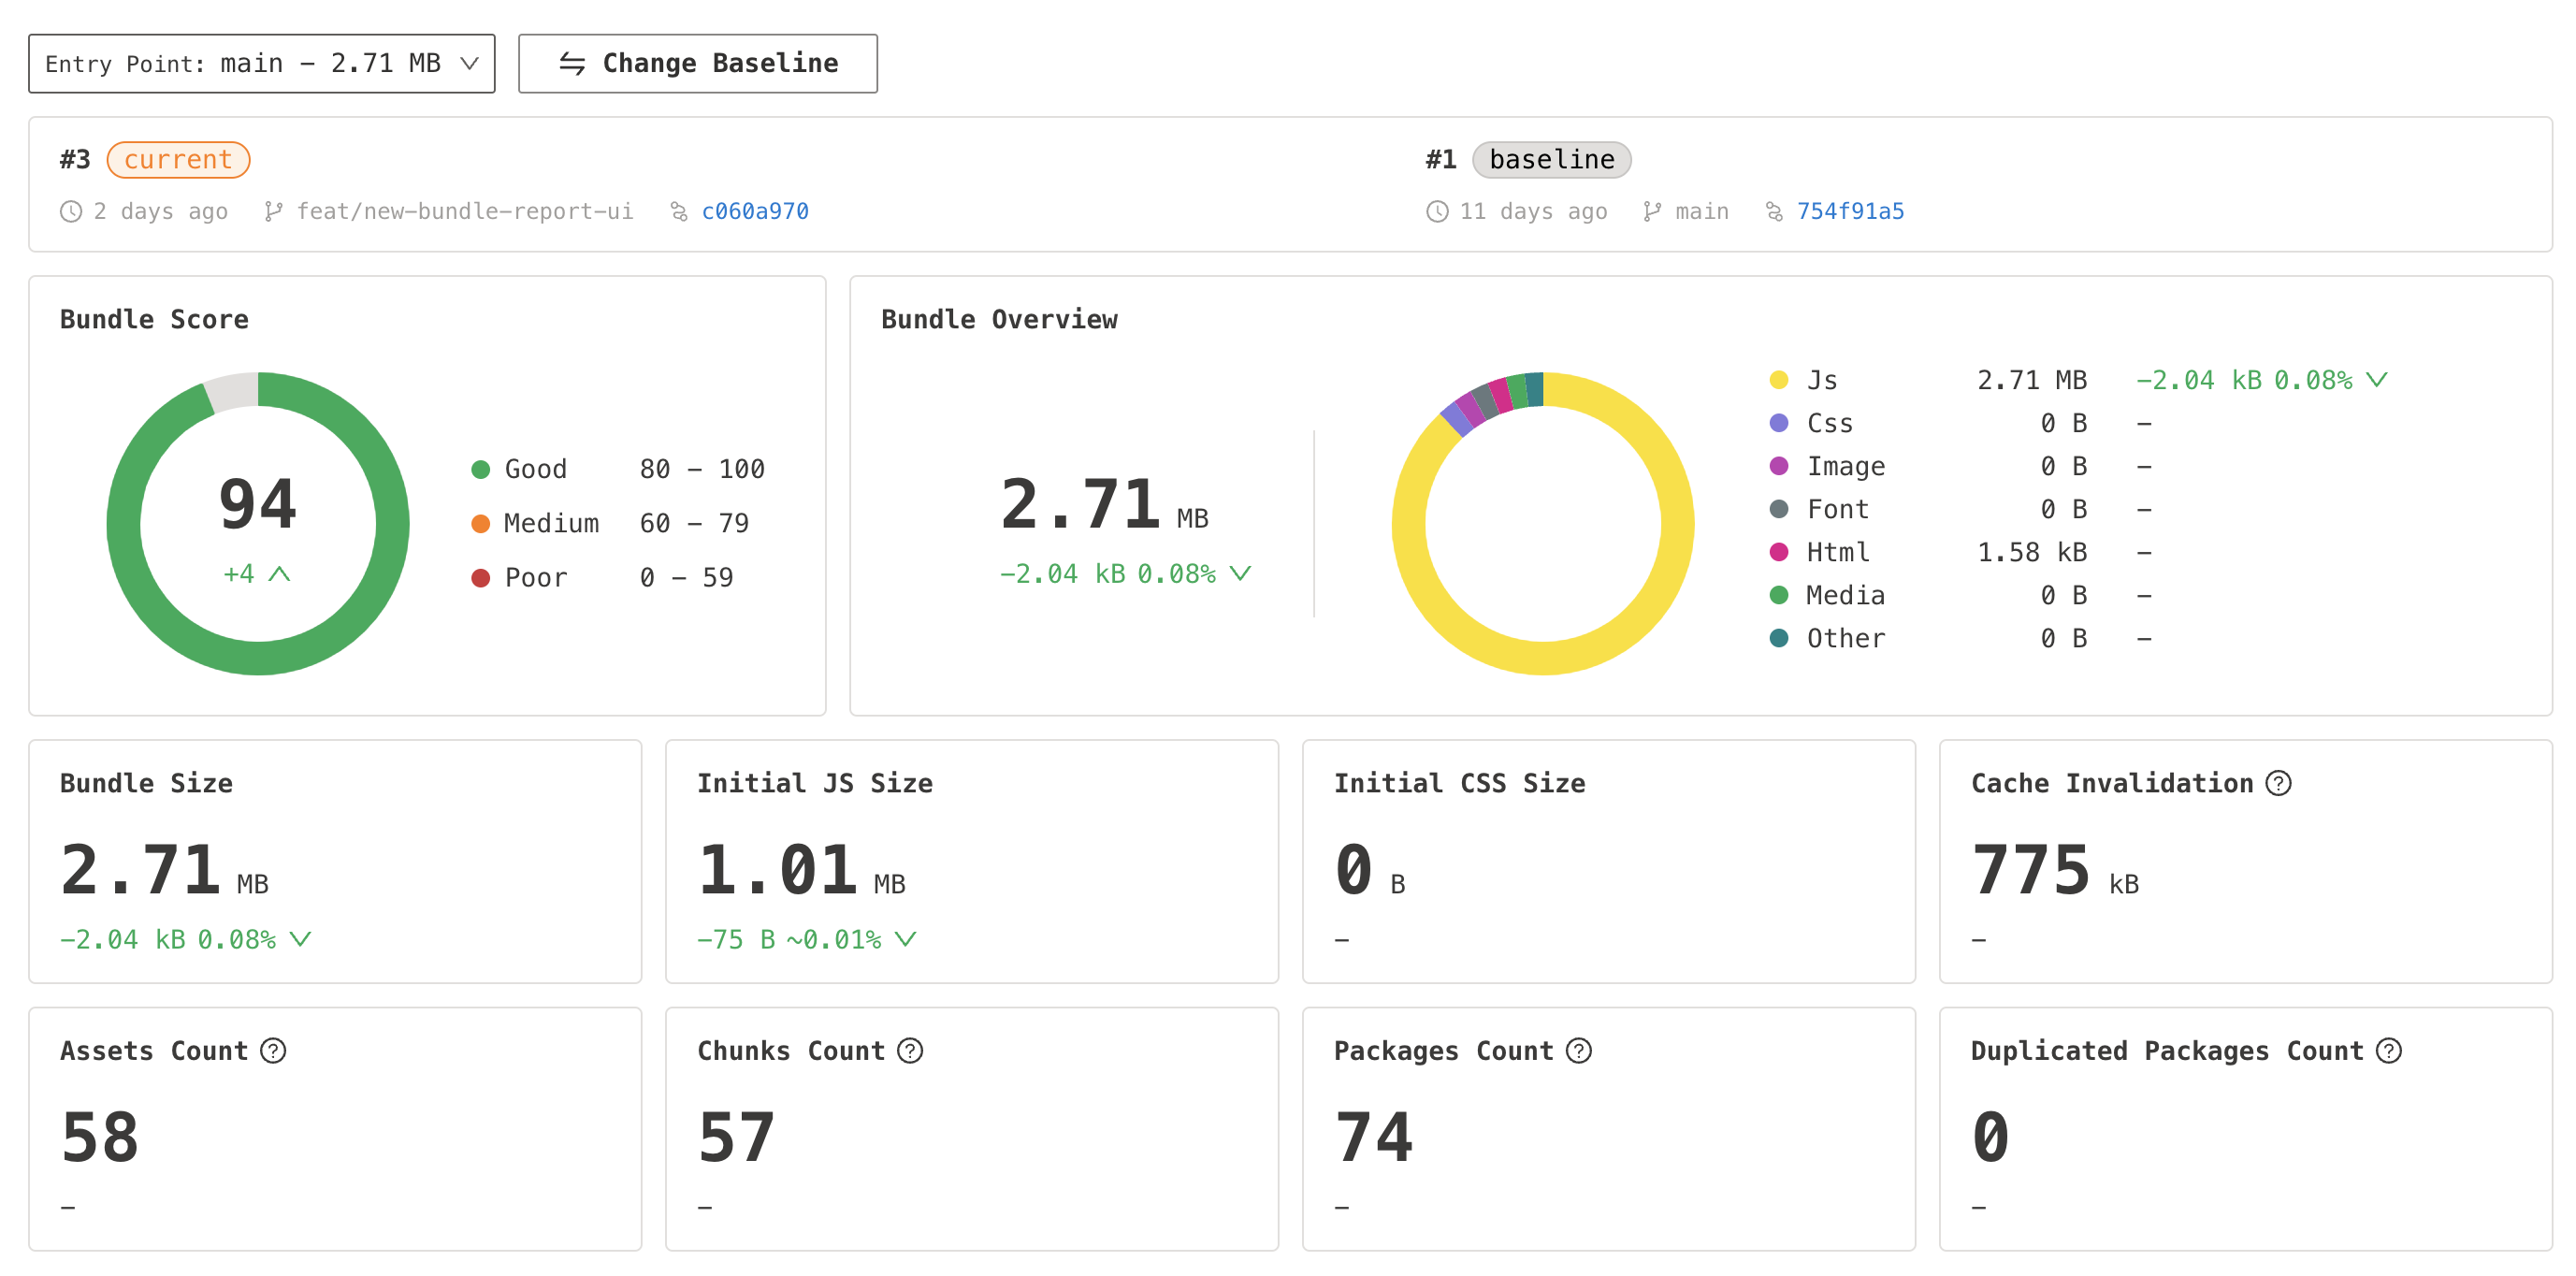
After selecting an entry point, the diff result of that entry with the same one in the baseline will be calculated, including the size of the total assets, initial JS files size, cache invalidation and such.
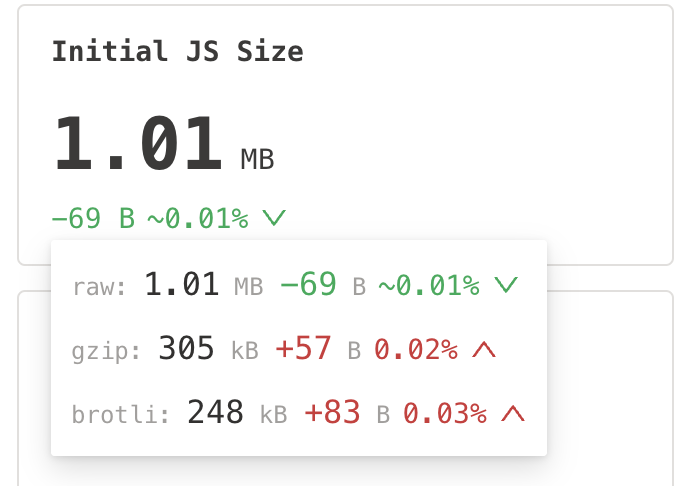
A popup will show up with more details after you hover over any of the size numbers.

In the picture above, Gzip compressed size is calculated with level 4, and the brotli compressed size is calculated with default options. reference. There might be some difference on the size with the one users actually download, but won't be much.
Cache Invalidation
When building the frontend project, we always configure the tools to ship assets with hash in the files name and upload them to the CDN so we could safely assign them a long cache expiration time.
Generally speaking, the data used to generate the hash is always the content of each file(so-called content hash), which means once the content of the file changes, the hash will change as well. In this way, users will always download the new files so that no catch can be hit.
Report content
The numbers in the pictures below are the same with the following capther numbers.
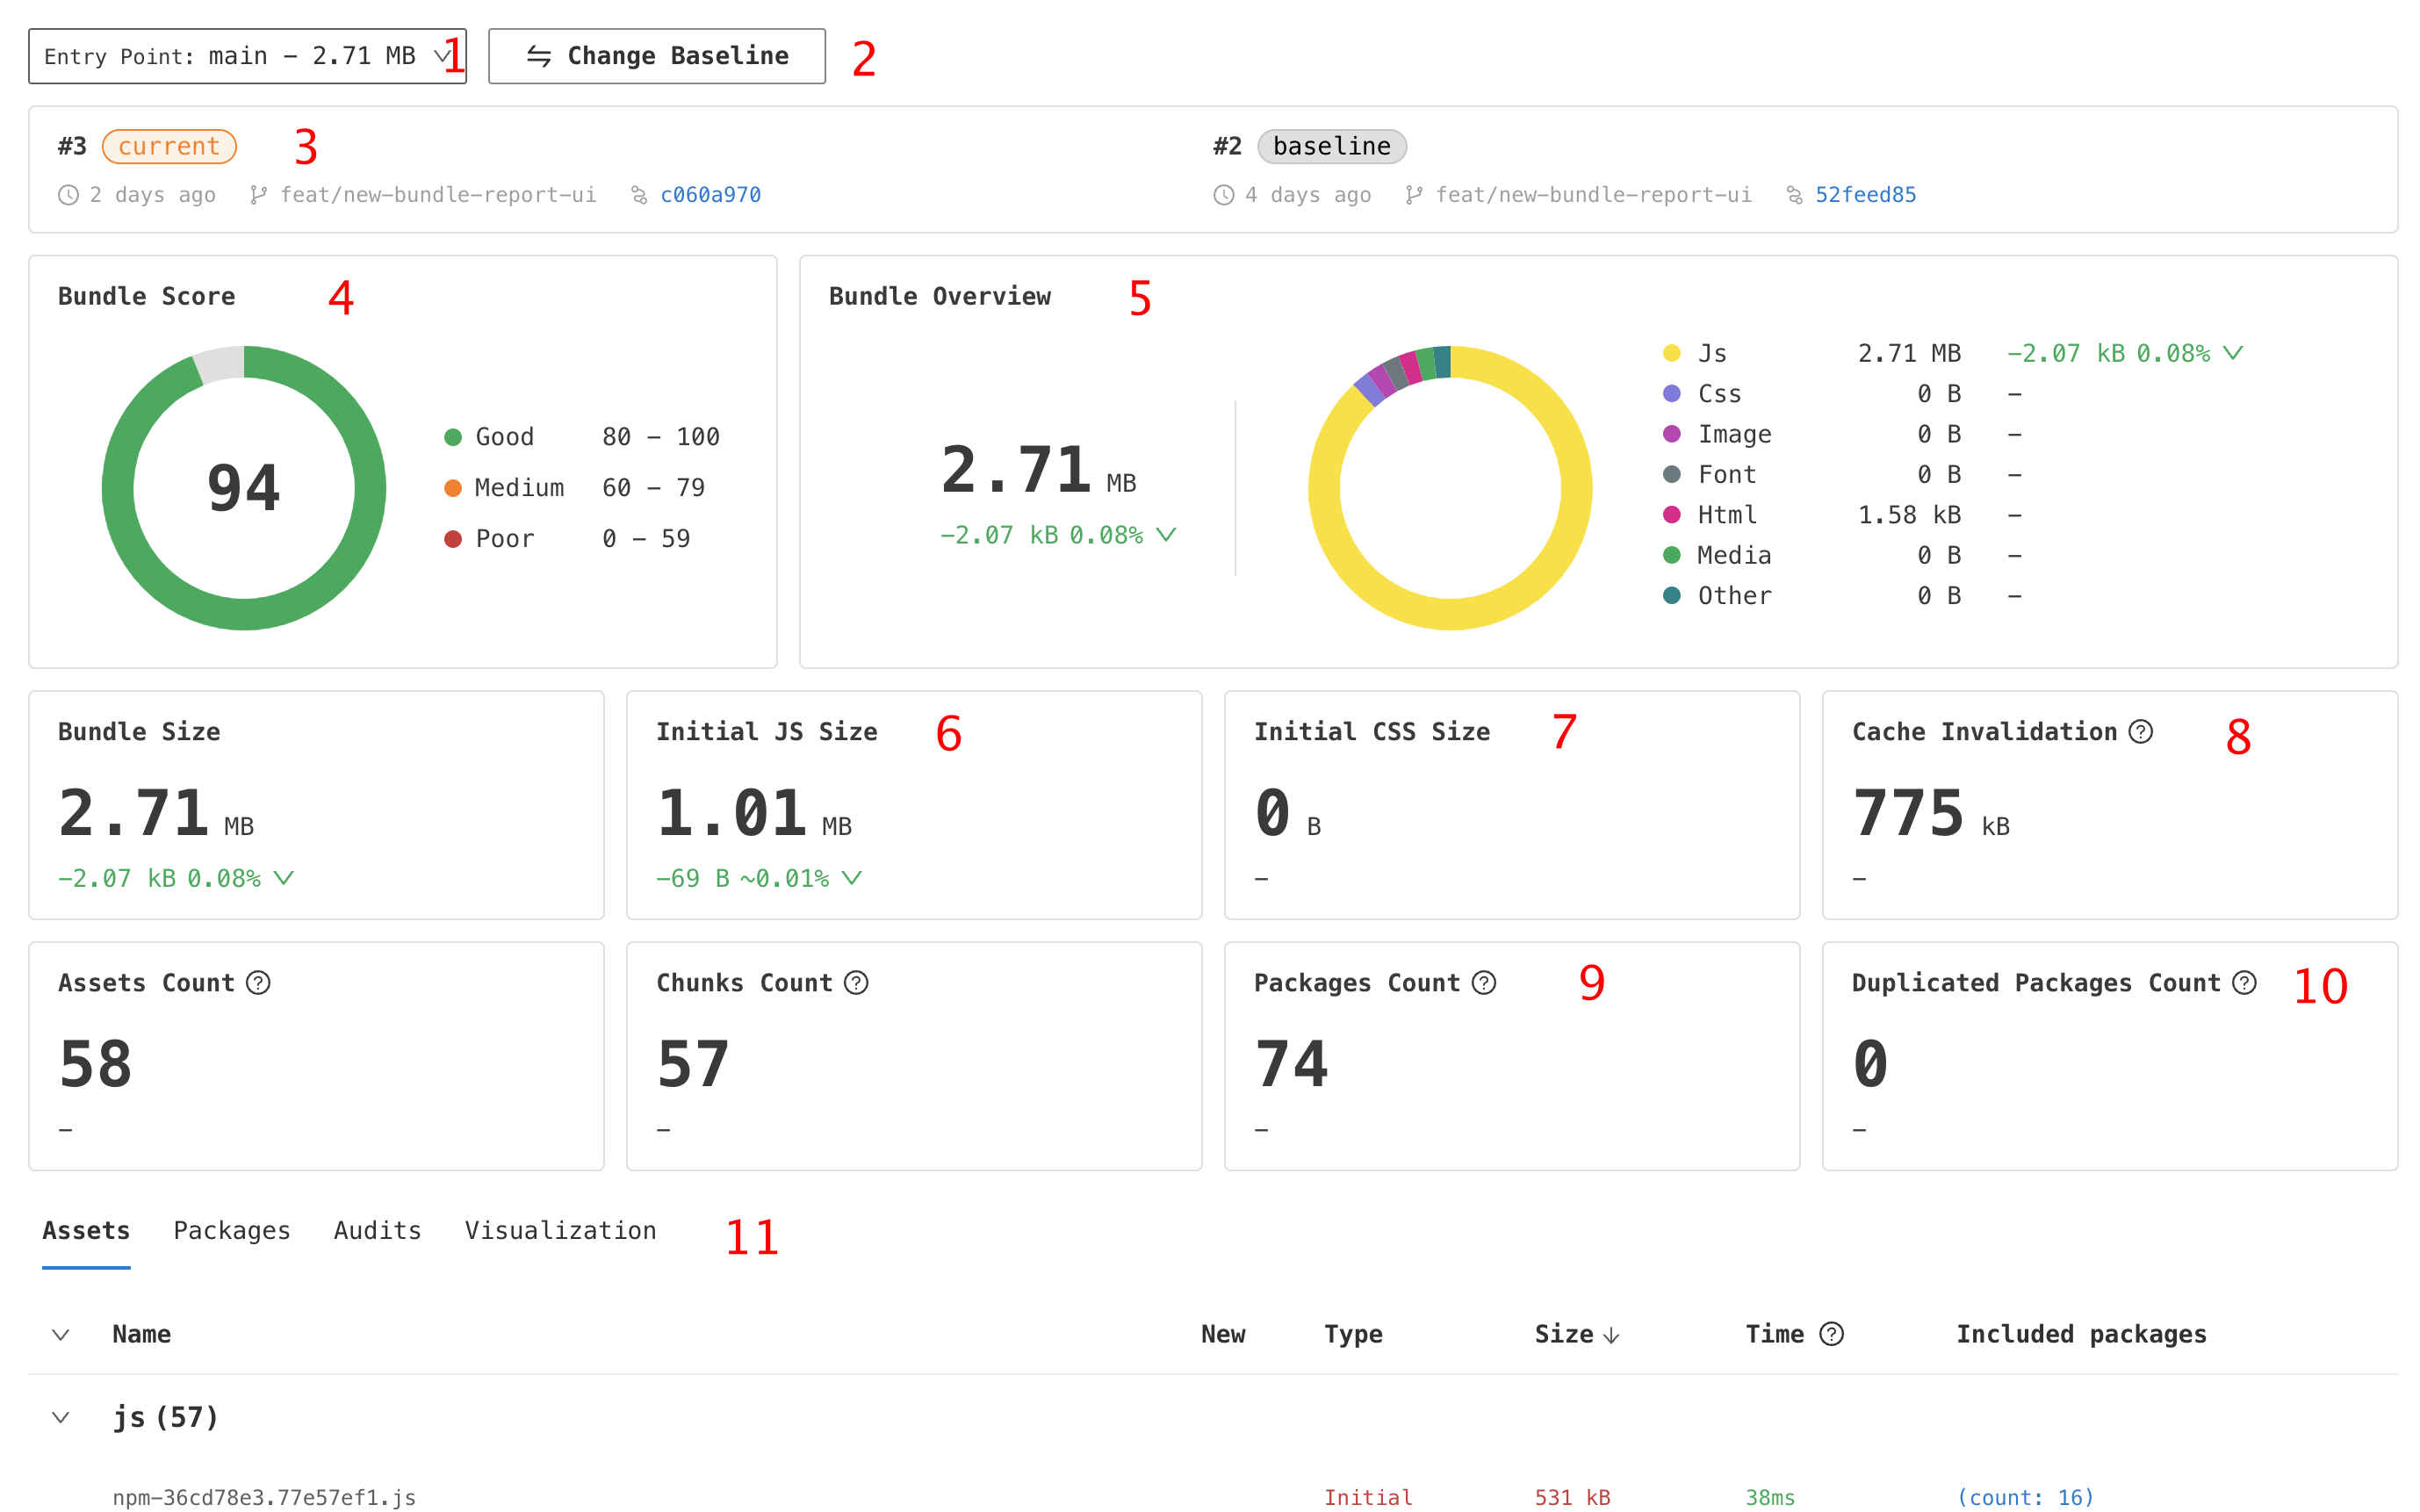
1. Entry Points
You can select and view the detail of each entry point in this dropdown.
2. Change the Baseline
It's free for you to choose any other build as the comparison baseline. A popup will show up and list all available builds.
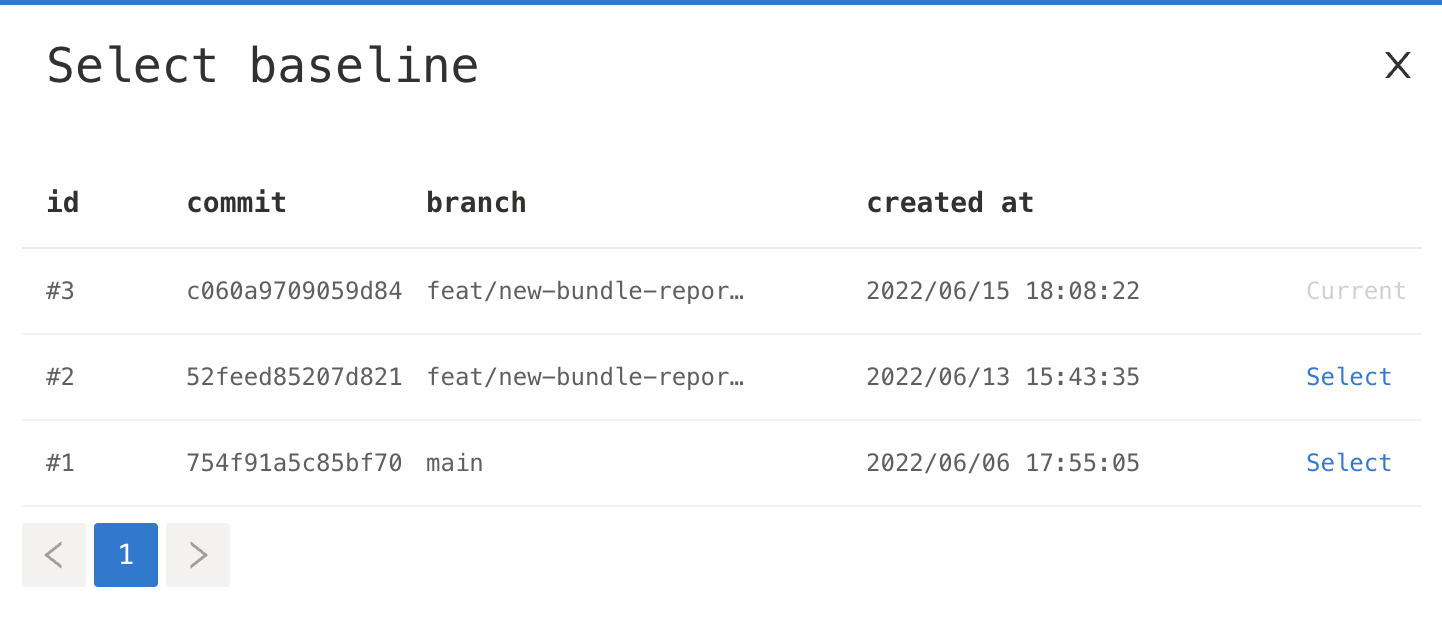
Keep in mind that the baseline is chosen and frozen once after the build gets uploaded, so selecting another baseline to be compared here just changes the frontend diff result.
3. Basic information
The basic information of the current build and baseline, including build date, commit hash, branch and so on.
4. Bundle Score
We have several predefined audit rules to calculate a score for each build. Check out Bundle Audits to see the rules and how we do the calculation.
5. Bundle Overview
Shows the total size of all asset files in this entry point and also the shares of each type.
6. Initial JS Size
Not all the JS files will be downloaded on the first screen. Big projects always prefer delaying some modules downloading to improve the first screen experience.
7. Initial CSS Size
Ditto
8. Cache Invalidation
The total size of the cache invalidated assets.
9. Packages Count
Total count of packages included in emitted assets.
Except for the packages imported by source code directly, like React or Vue, the packages indirectly imported count as well.
The Packages Table shows more in detail.
The third-party packages results provided by Perfsee are those packages exactly bundled into the final assets. We don't collect them by scanning node_modules folder or reading packages.lock/yarn.lock file.
So this information provides a strong credential to optimize your bundle.
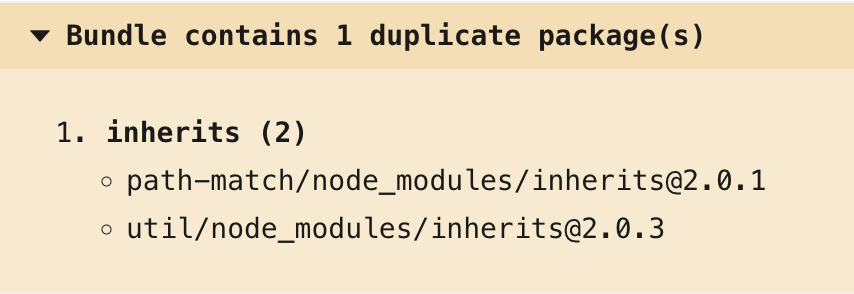
10. Duplicated packages
Normally, bundle tools won't pack the same package more than once into final JS files, but if some of your dependencies import different versions of other dependencies, you may encounter this situation.
For instance, your source code directly depends on foo@2.0 and bar@1.0, and at the same time, bar@1.0 depend on foo as well but the semantic version set in its package.json is foo@^1.0. In this case, no matter what package manager you use, foo@2.0 and foo@^1.0 will be definitely resolved to different versions and both of them will exist in your bundle outputs.
We provided a list of duplicated packages with import paths of them for helping you debug such a problem.
11. Bundle content in detail
We have 4 tabs with different tables or lists to show you the great detail of your bundle. They are:
- List of all files that users will download when visiting your pages
- List of all packages that the files included and a lot more information
- List of all applied audit rules and applicable optimization suggestions
- Visualization of all modules and their reference relationship
Tabs
Assets
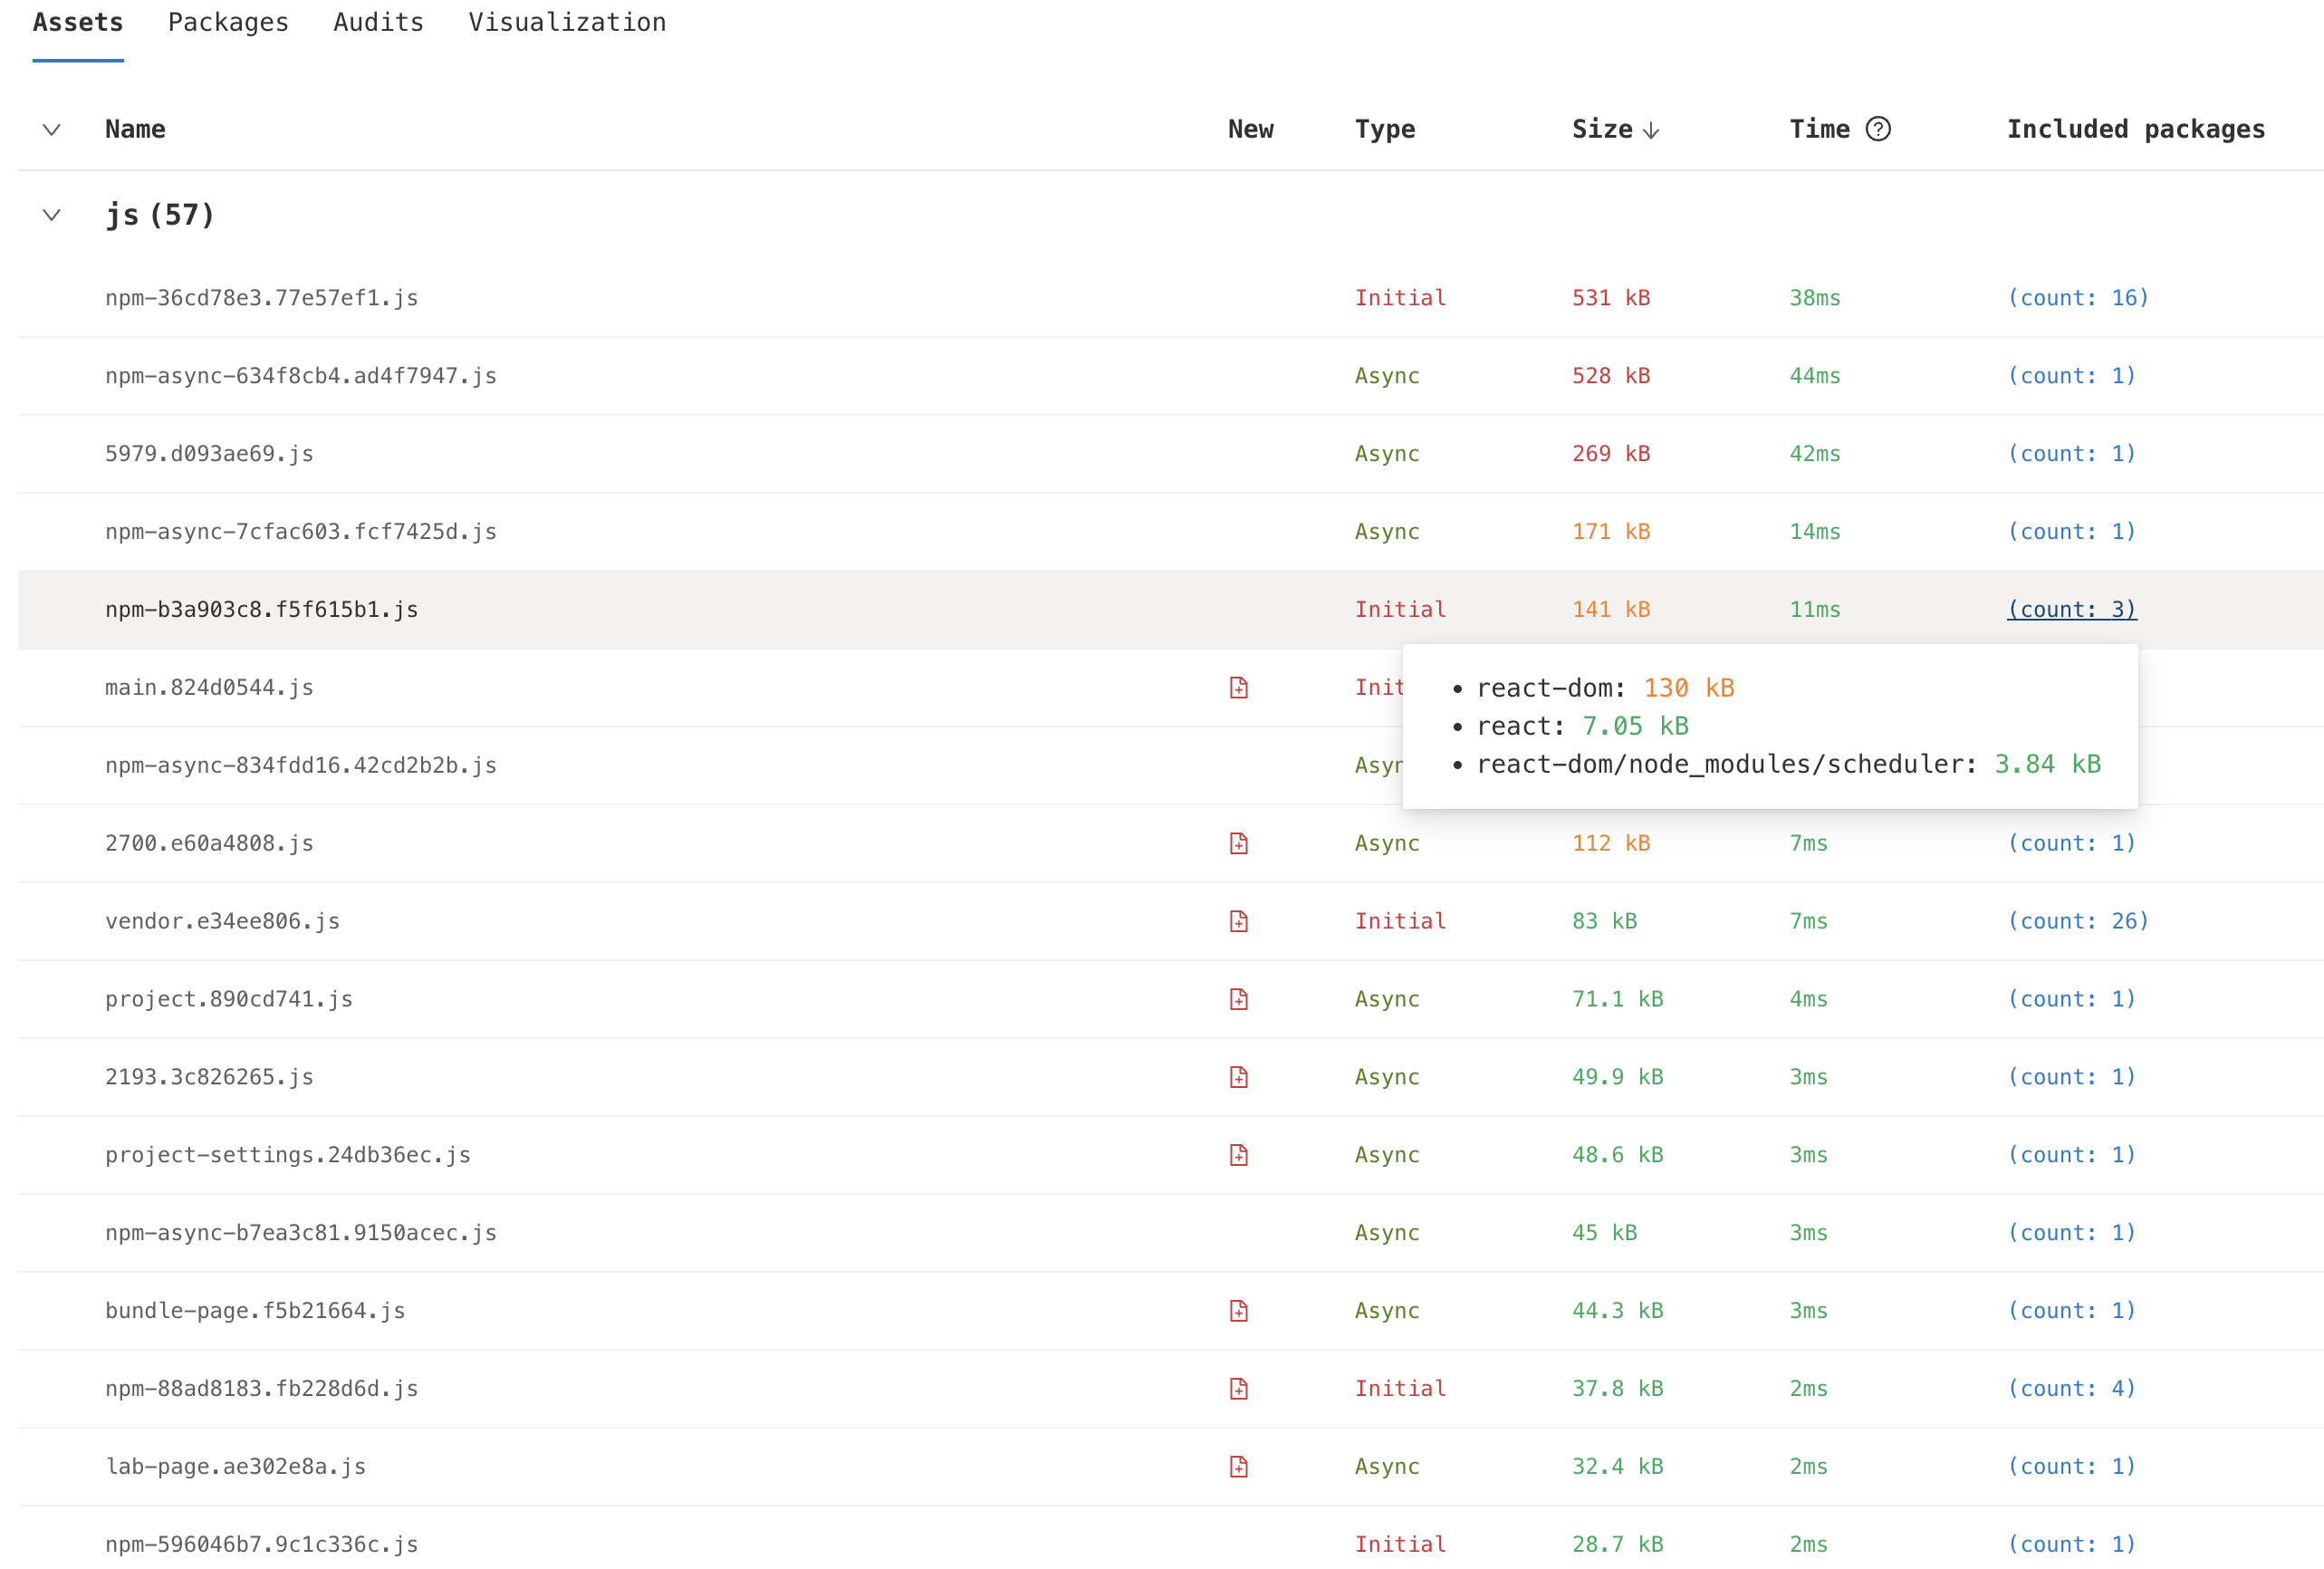
Columns:
| Name | Description |
|---|---|
| Name | relative name of files. relative to webpack output path configuration |
| New | whether is a new file |
| Type | Whether initial loaded file |
| Size | File size |
| Time | Estimated file downloading time |
| Included Packages | packages with sizes included in given file |
More Explanation
We use such speeds to calculate the estimated downloading time:
- Slow 3G: 40 KB/s
- Good 3g: 196 KB/s
- Regular 4G: 1.5 MB/s
- LTE 4G: 3 MB/s
- wifi: 3.9 MB/s
- cable: 5 MB/s
Included Packageswill show you the size of the packages bundled in each file. These sizes are the actual sizes bundled in the file, not the size of the whole package.For instance, in the above picture, the total size of package
@fluentui/reactis538KB(which is available in Packages Table), but filenpm-36cd78e3.753182e1.jsonly contains494 KBof this package, which means the rest of that package is bundled into other files.Packages with
(concatenated)before their names means they are processed by Webpack'sModule Concatenationfeature, and merged into other modules, leading to we can't recognize the real used size of them. But be relaxed, it doesn't mean we calculate the wrong size number. The size is just appended to the other package's size, but the total number is correct.
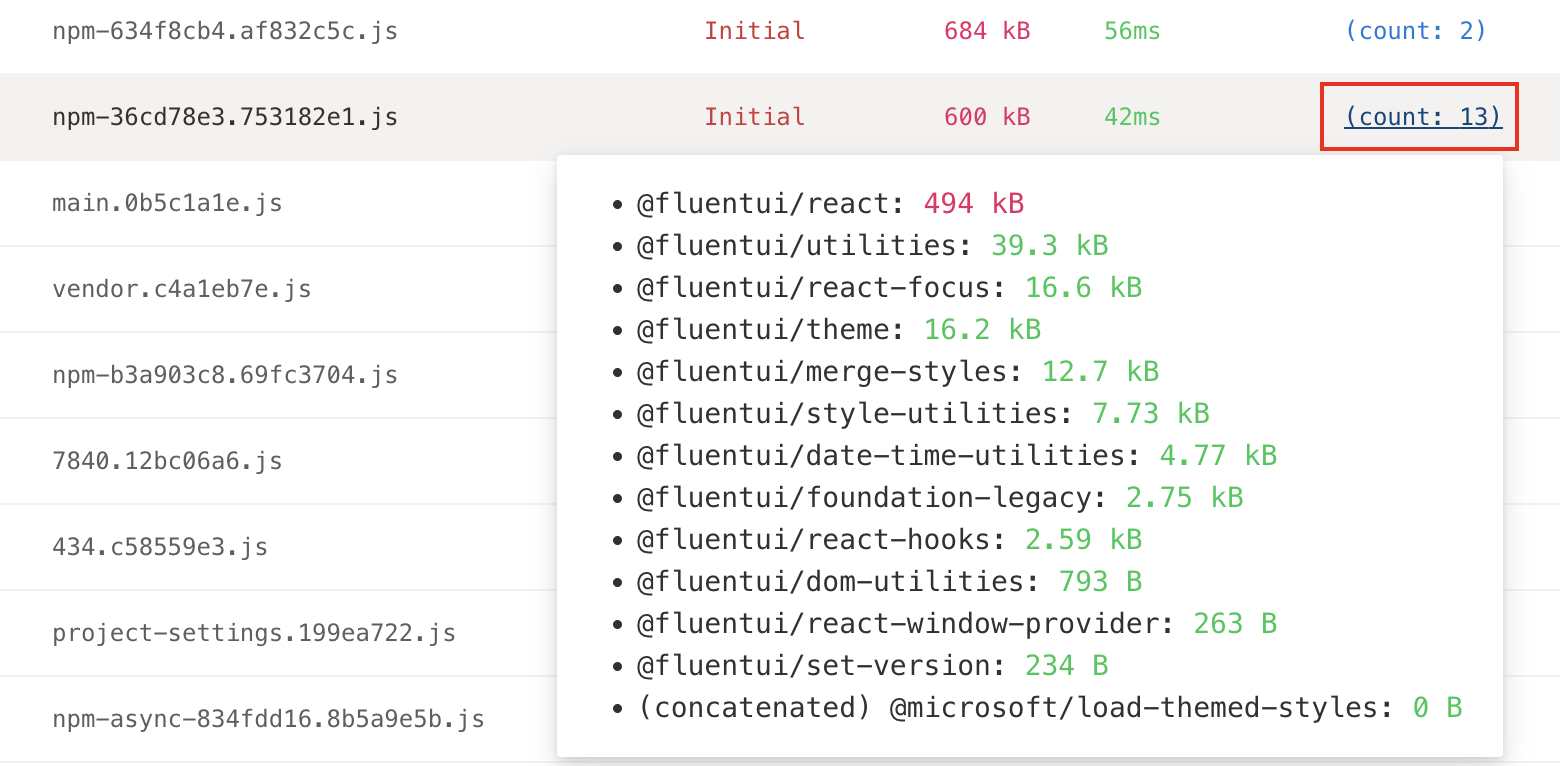
- The reason why the comparison with baseline is not given here is that we think all the content updates of static resources will show up on the file name(with the hash of content), so the diff size of the file will either be 100% or 0%, which is non-sense to be shown.
Packages
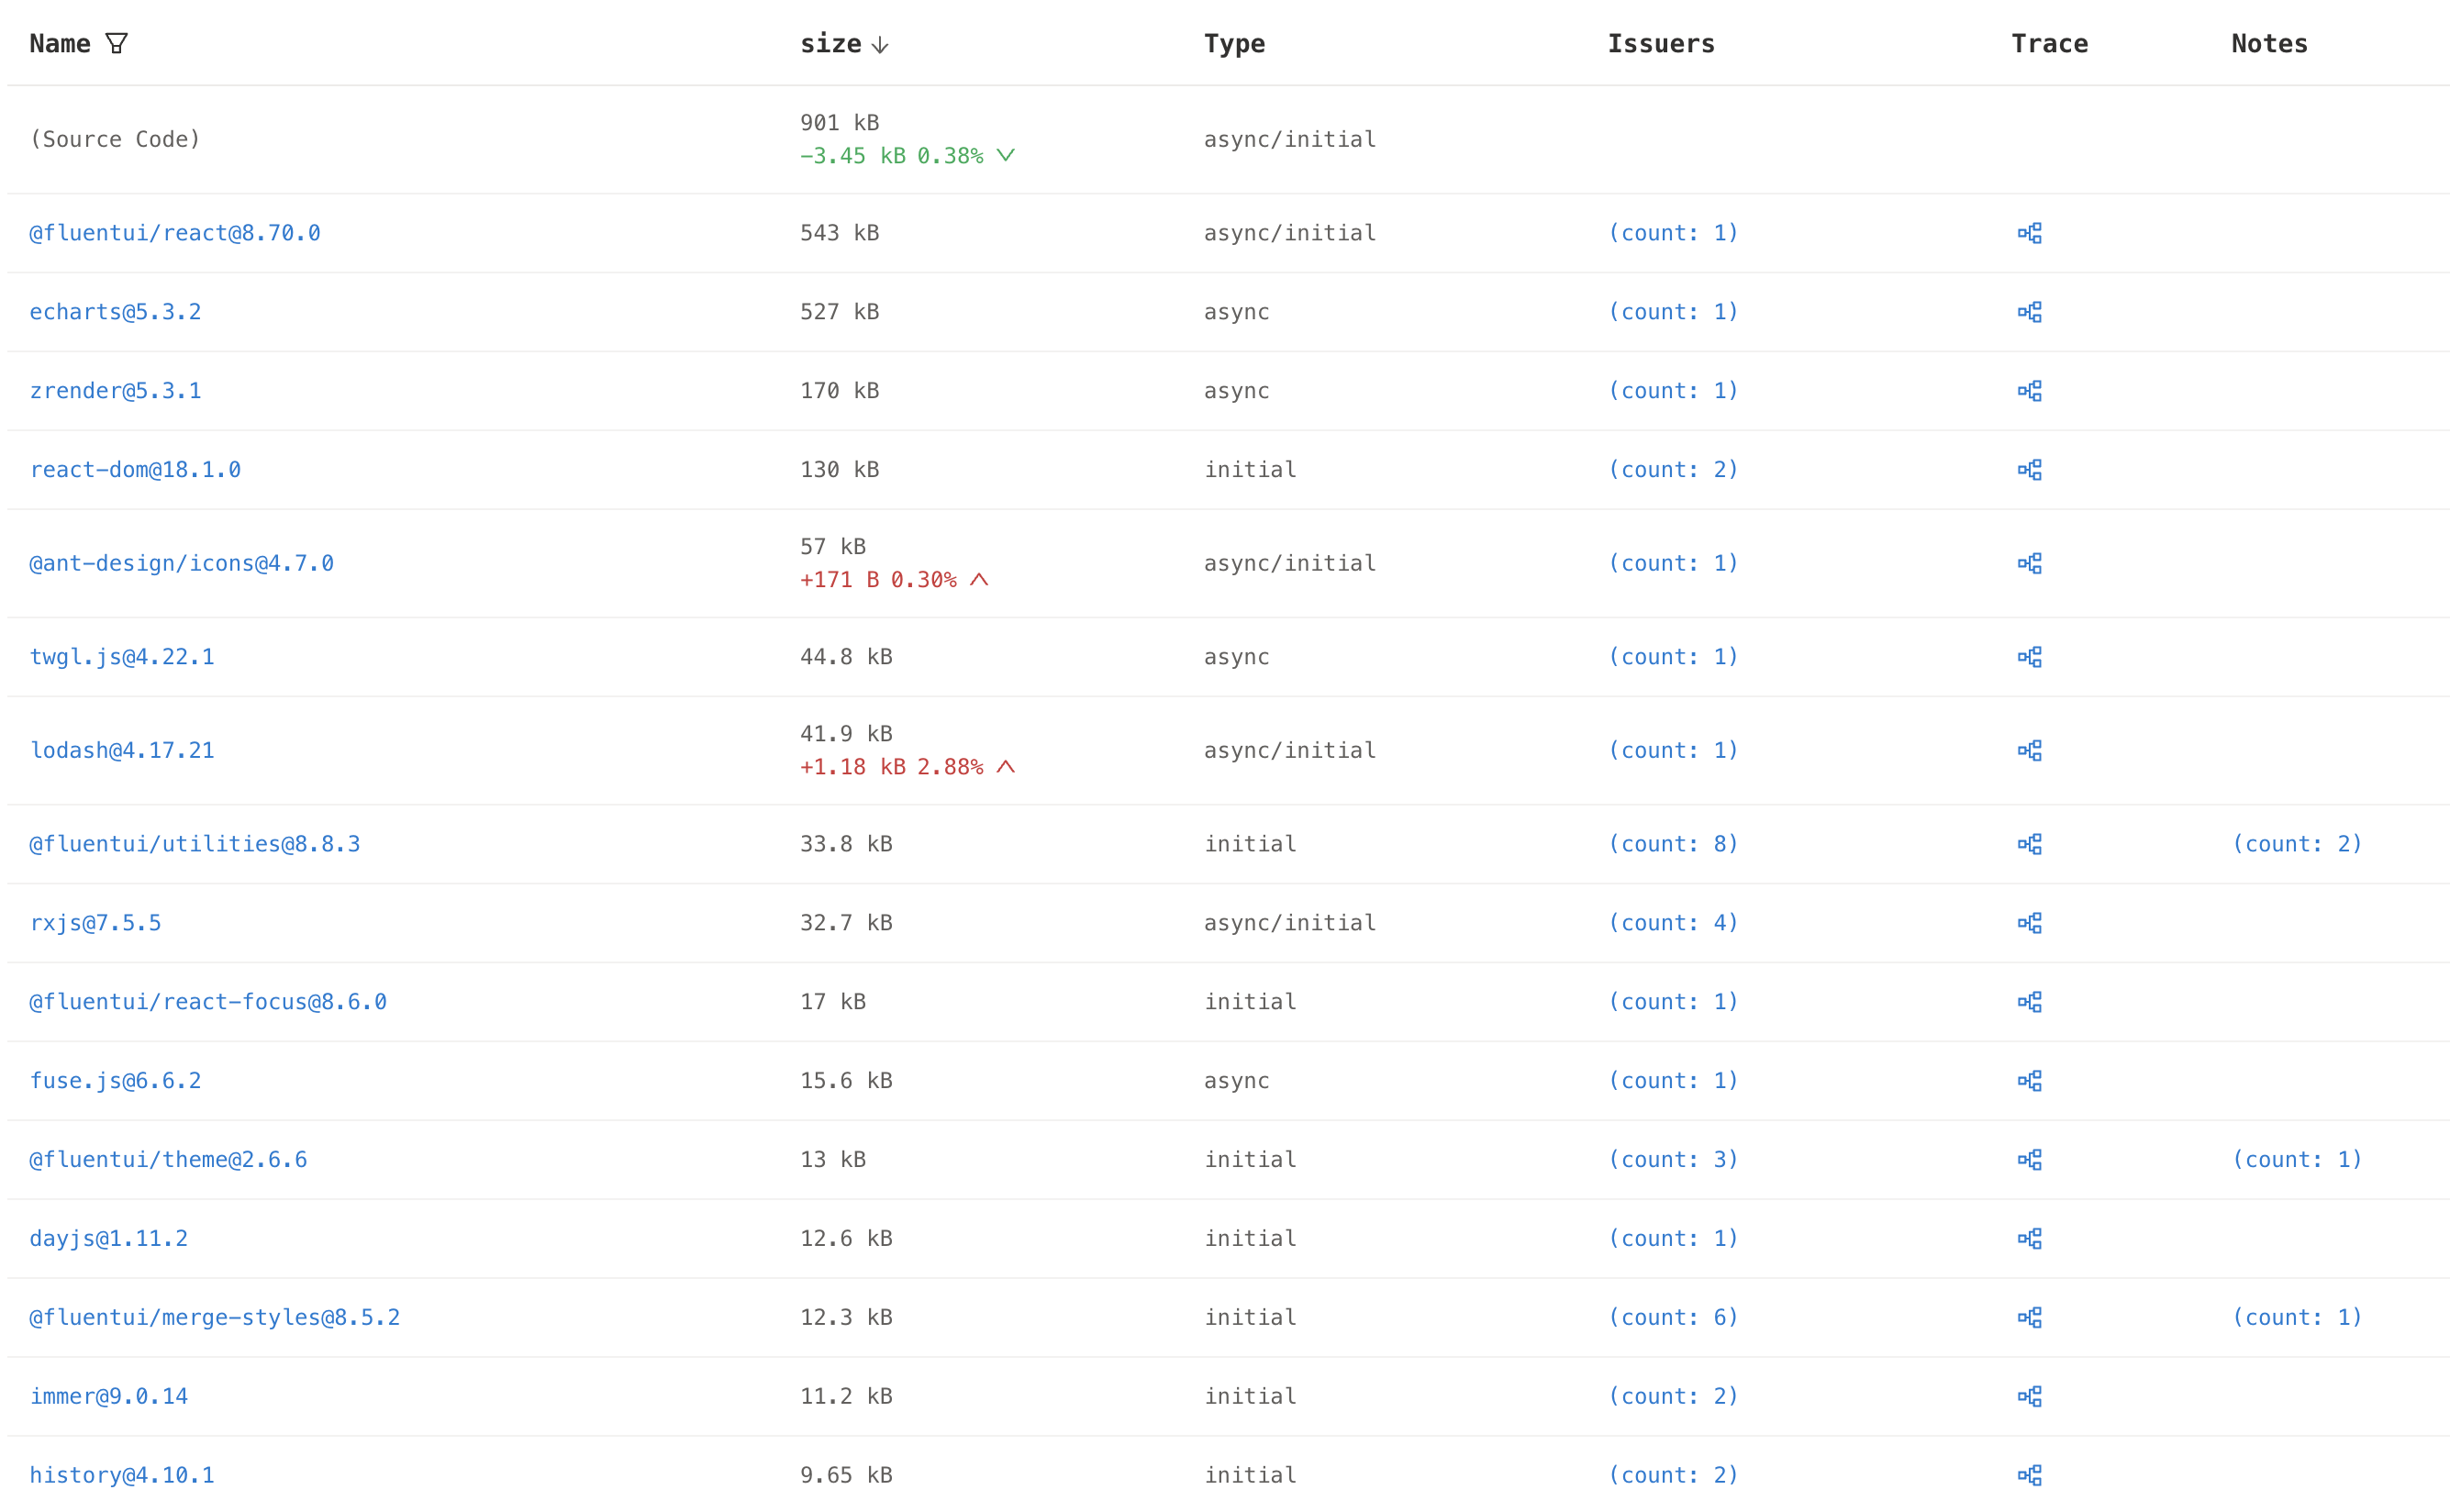
Columns:
| Name | Description |
|---|---|
| Name | Package name and it's version |
| Current | Total size introduced in current version |
| Baseline | Total size introduced in baseline version |
| Type | Loading type |
| Issuers | Those packages that import this one |
| Notes | Some hint, like Module Concatenation information |
| Trace | Visualization of import trace |
Explanation
- duplicated packages will show in relative paths, like
lodash@xandfoo/node_modules/lodash@y, the lastlodashis imported by packagefoo. - The size of each package is the sum of sizes introduced in all assets in the current entry point, and it may not equal the size of all files in that package. For example, if you configure Webpack to use the
treeshakingfeature, the unused code with no side effects will be removed, and the size of the package will be smaller. - Loading type shows all the possible loading type of assets that contains this package. There is a hoverable effect showing files that contain this package and the size shares this package takes in them.

- Issuers show all the packages that import this package if there are. It's convenient to find the reason for bundling some unexpected packages.
- Notes show some extra information that may not quite important for packages. Currently, there is only one note type, which is
Module Concatenationinformation, and there might be more in the future.
The size of some packages may be 0, which means code of those packages are all merged into other packages by
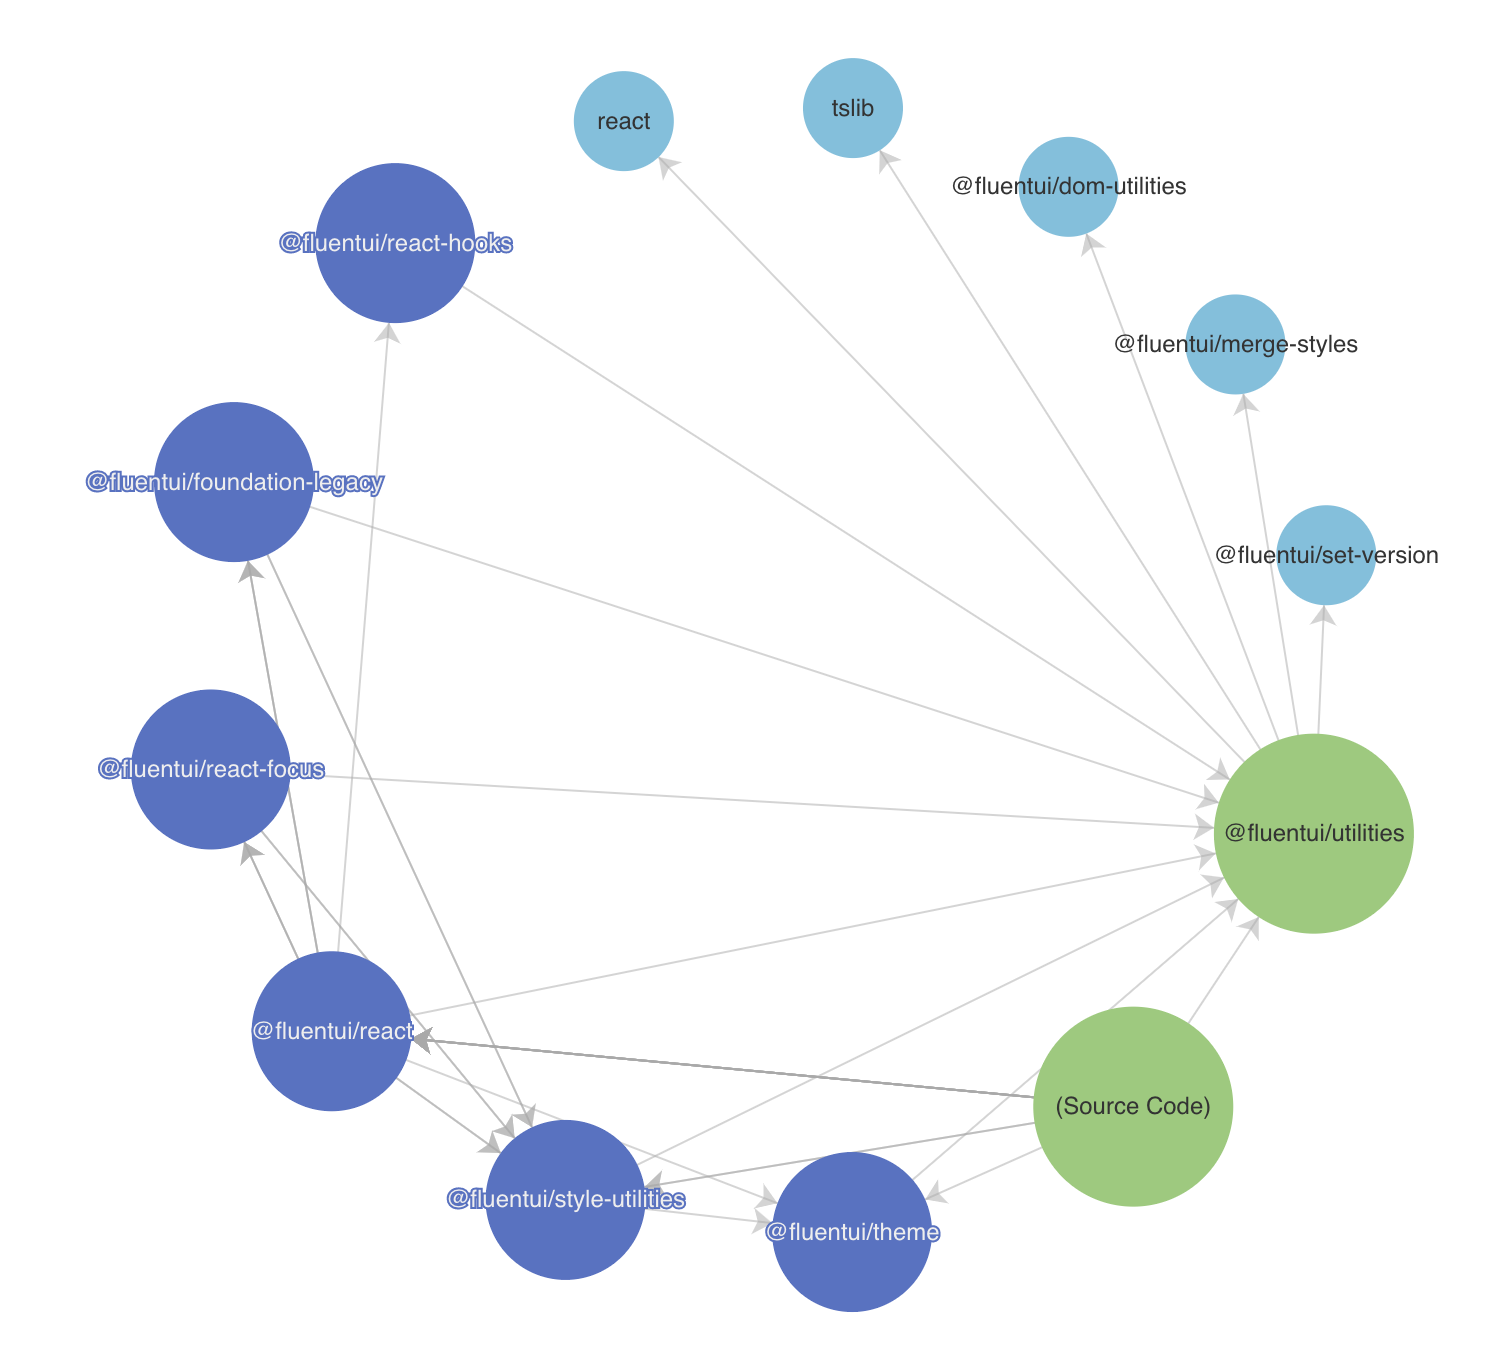
Module Concatenationfuture, and we lost the track of their size. - The import trance show all import paths that lead to this package getting bundled.
'A ----> B' means 'A import B'。
Audits
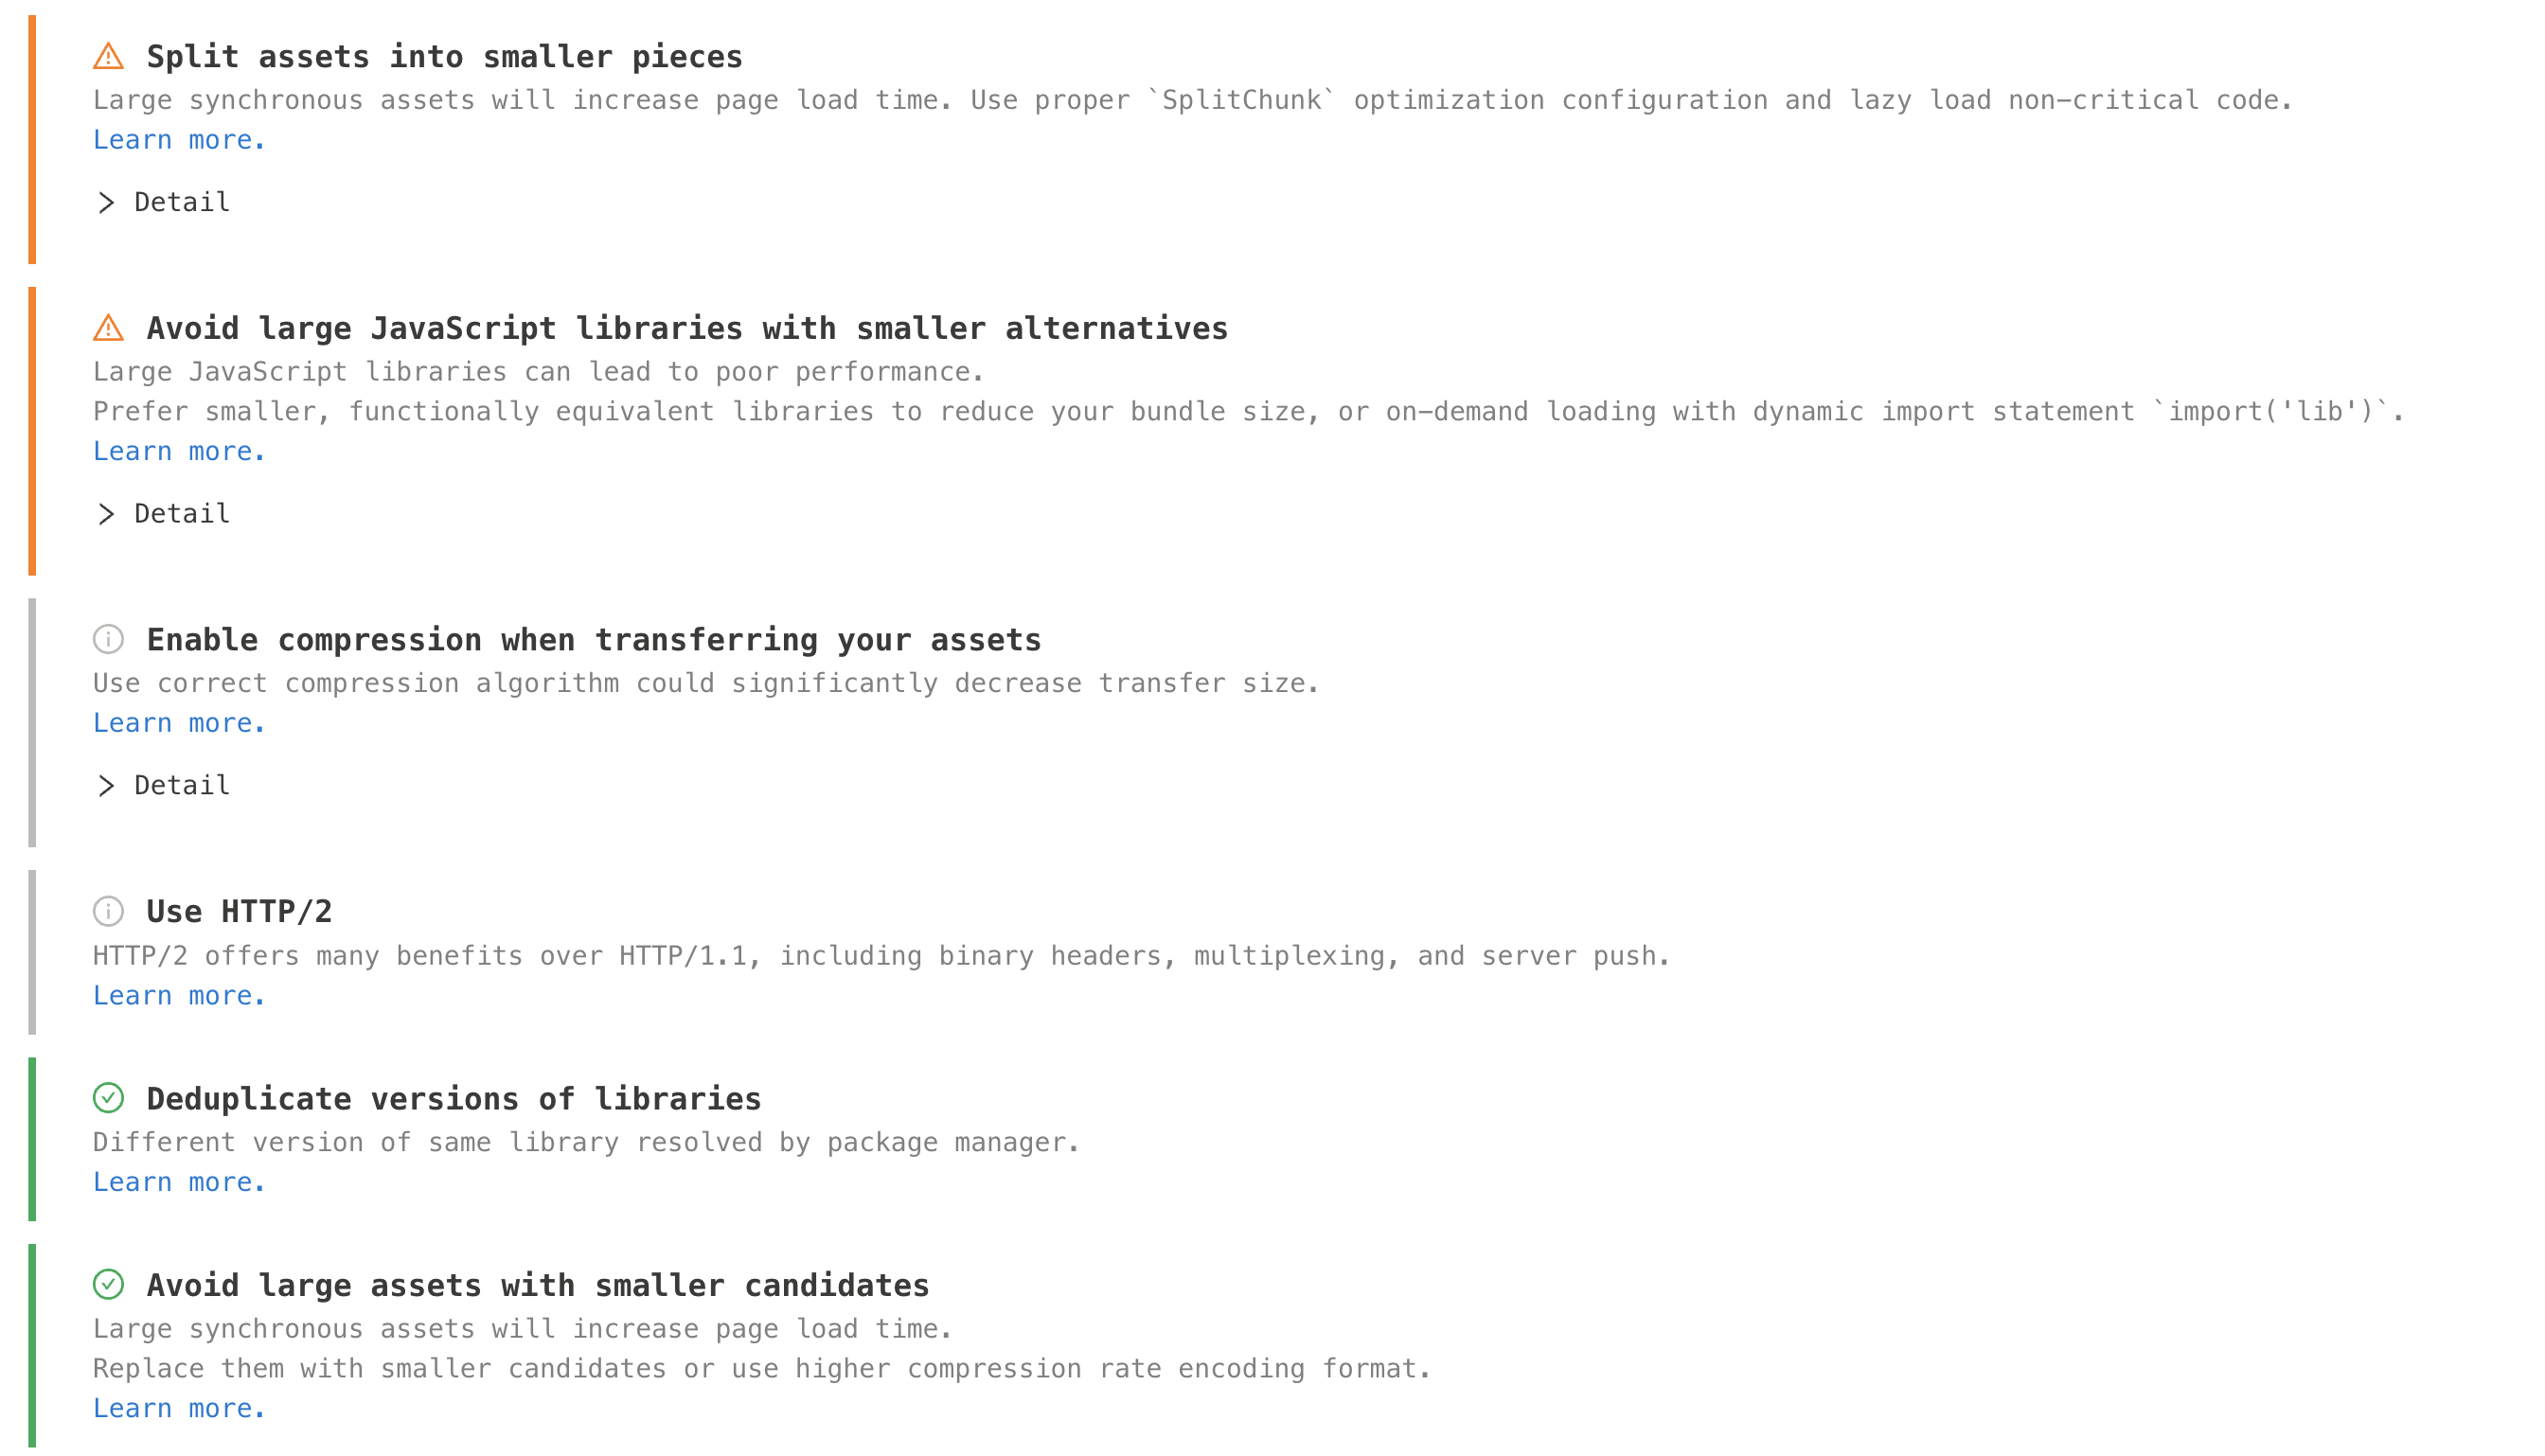
See more detail in Bundle Audits
Visualization
At the same time, we provided a visualization graph as WebpackBundleAnalyzer do so you can know the module references of your project better.
